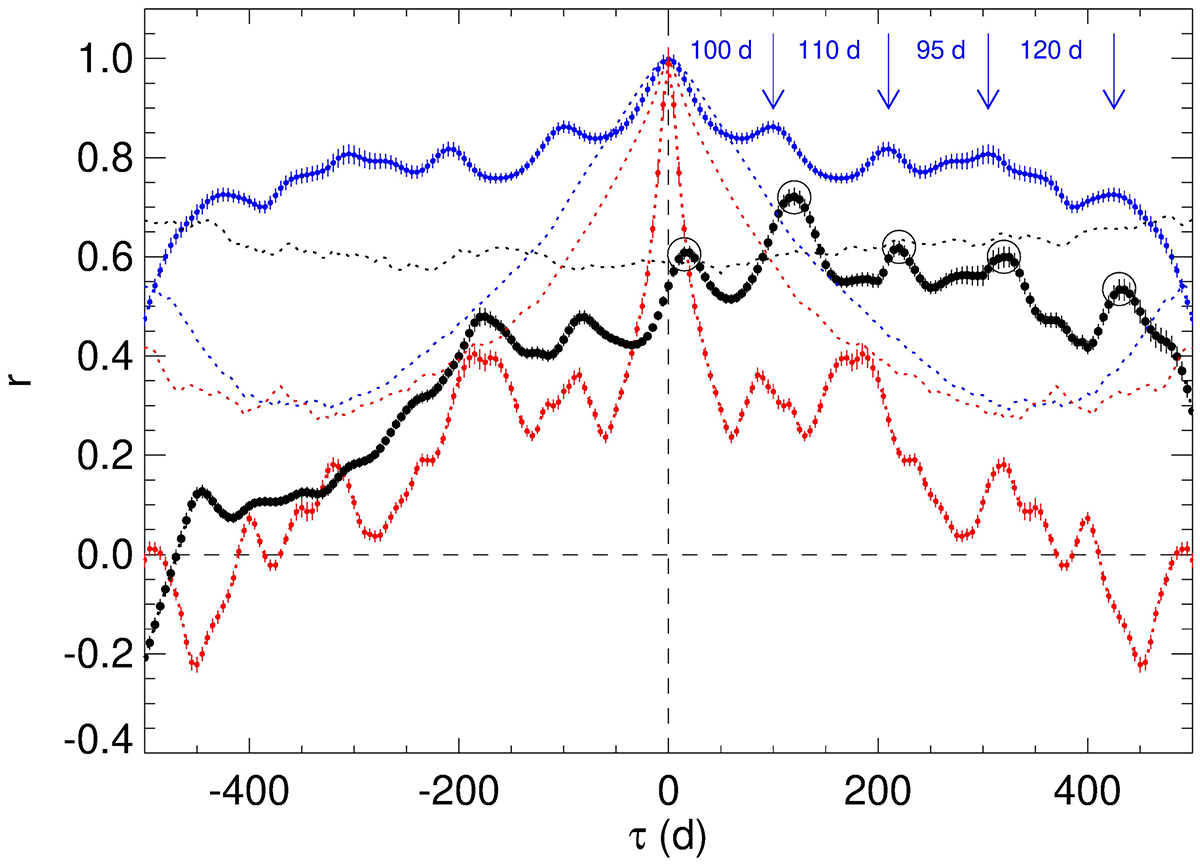
Fig. 4.
Download original image
DCF between optical and radio cubic spline interpolations to corresponding light curves, used as proxies for viewing angles (black dots). Large empty circles highlight the highest DCF peaks. The blue and red dots represent the ACFs of the radio and optical splines, respectively. The vertical arrows mark the radio ACF peaks, which are separated by time lags τ of 95−120 d. Dotted lines represent 90% confidence levels of the ACFs and DCF of the same colour, which were obtained by cross-correlating splines on 1000 optical and 1000 radio simulated light curves, according to the method discussed in Emmanoulopoulos et al. (2013).
Current usage metrics show cumulative count of Article Views (full-text article views including HTML views, PDF and ePub downloads, according to the available data) and Abstracts Views on Vision4Press platform.
Data correspond to usage on the plateform after 2015. The current usage metrics is available 48-96 hours after online publication and is updated daily on week days.
Initial download of the metrics may take a while.