Fig. B.1.
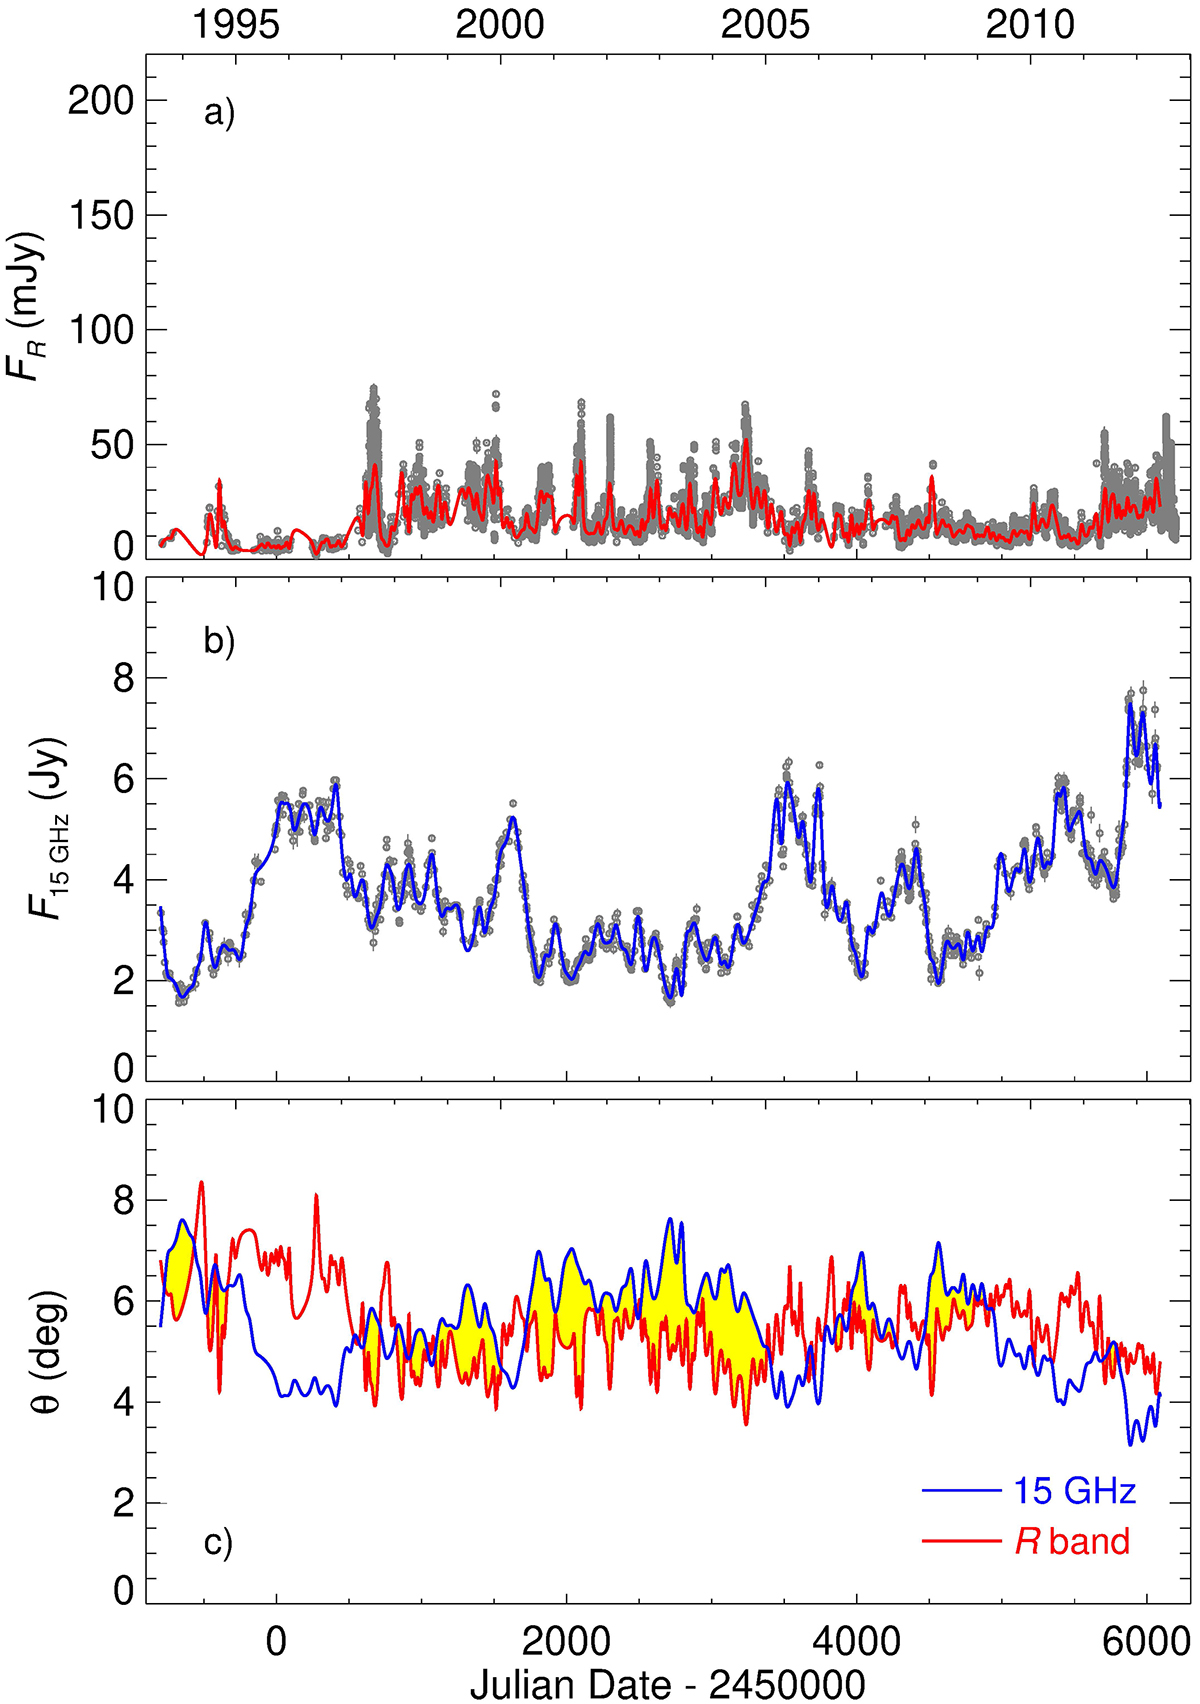
Download original image
Flux densities in the R band (a) and at 15 GHz (b) in 1993–2012, and behaviour in time of the viewing angle (c) of the optical emitting region (red) and of the radio emitting region (blue). The red and blue lines in panels (a) and (b) show cubic spline interpolations on the binned optical and radio data, respectively. They represent the long-term trends of the flux. In the bottom panels the yellow areas highlight the periods where the optical emitting region is better aligned with the line of sight than the radio zone and hence the optical radiation is more beamed than the radio emission.
Current usage metrics show cumulative count of Article Views (full-text article views including HTML views, PDF and ePub downloads, according to the available data) and Abstracts Views on Vision4Press platform.
Data correspond to usage on the plateform after 2015. The current usage metrics is available 48-96 hours after online publication and is updated daily on week days.
Initial download of the metrics may take a while.