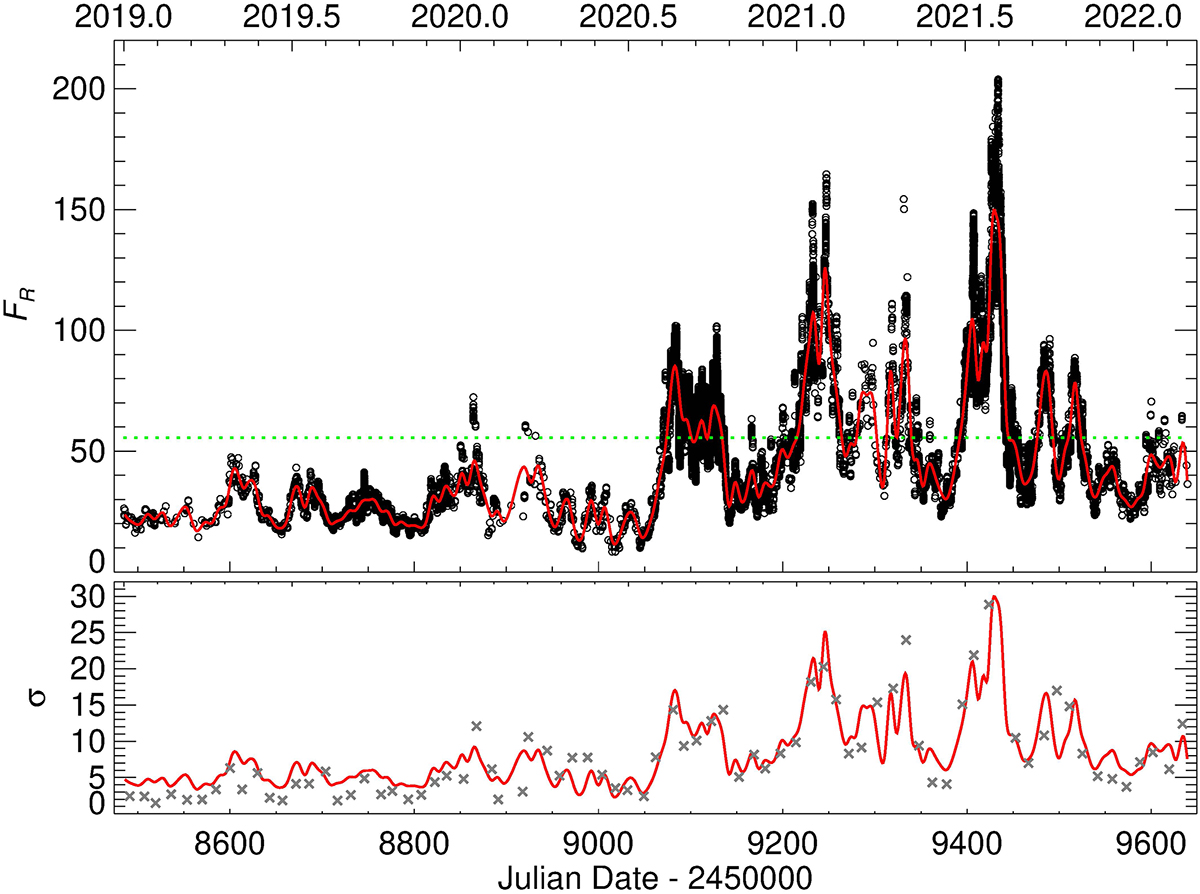
Fig. 12.
Download original image
Results of the wavelet analysis. (a) Optical light curve of BL Lacertae in 2019–2022. The green dashed line represents the flux level corresponding to the median value of the Doppler factor, δmed = 14.96. (b) Wavelet spectrum for optical light curve. The green dashed line marks a timescale of 2.5 d, which is between those found in high- and low-brightness states with the SF and ACF (see Fig. 11).
Current usage metrics show cumulative count of Article Views (full-text article views including HTML views, PDF and ePub downloads, according to the available data) and Abstracts Views on Vision4Press platform.
Data correspond to usage on the plateform after 2015. The current usage metrics is available 48-96 hours after online publication and is updated daily on week days.
Initial download of the metrics may take a while.