Fig. 3
Download original image
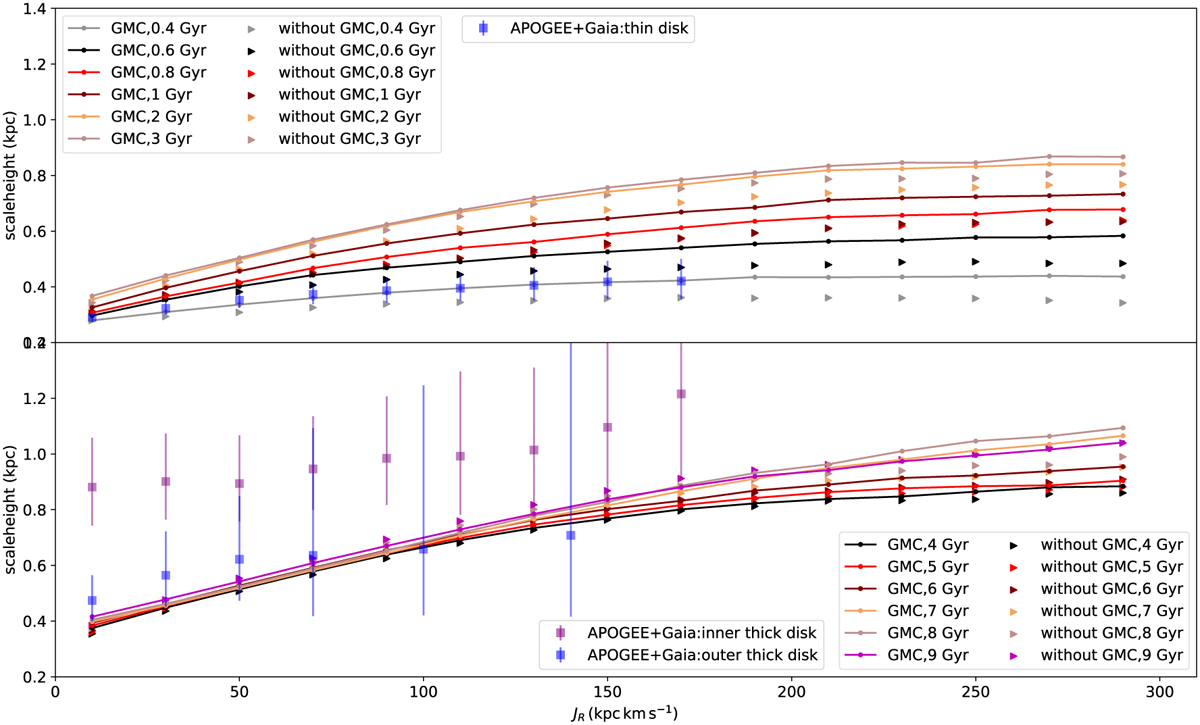
Relationships between radial action and scale height for GMC and without-GMC simulations. The lines with dots show the results of the GMC simulation, while the triangles show the results of the without-GMC simulation. To more clearly demonstrate that the relationships between radial action and scale height in the GMC and without-GMC simulations are nearly identical after 4 Gyr, the upper panel exclusively displays results from simulations up to 3 Gyr, while the results from simulations beyond 3 Gyr are presented in the bottom panel. In each panel, the lines and triangles are colored differently to represent various simulation time points. If a line and its corresponding triangles share the same color, they indicate the same simulation time. For clarity, the typical range of uncertainties in scale height, which is between 0.01 kpc and 0.02 kpc, is not shown here. The squares accompanied by error bars represent the results of J23, which were obtained using data from APOGEE and Gaia.
Current usage metrics show cumulative count of Article Views (full-text article views including HTML views, PDF and ePub downloads, according to the available data) and Abstracts Views on Vision4Press platform.
Data correspond to usage on the plateform after 2015. The current usage metrics is available 48-96 hours after online publication and is updated daily on week days.
Initial download of the metrics may take a while.