Fig. 1
Download original image
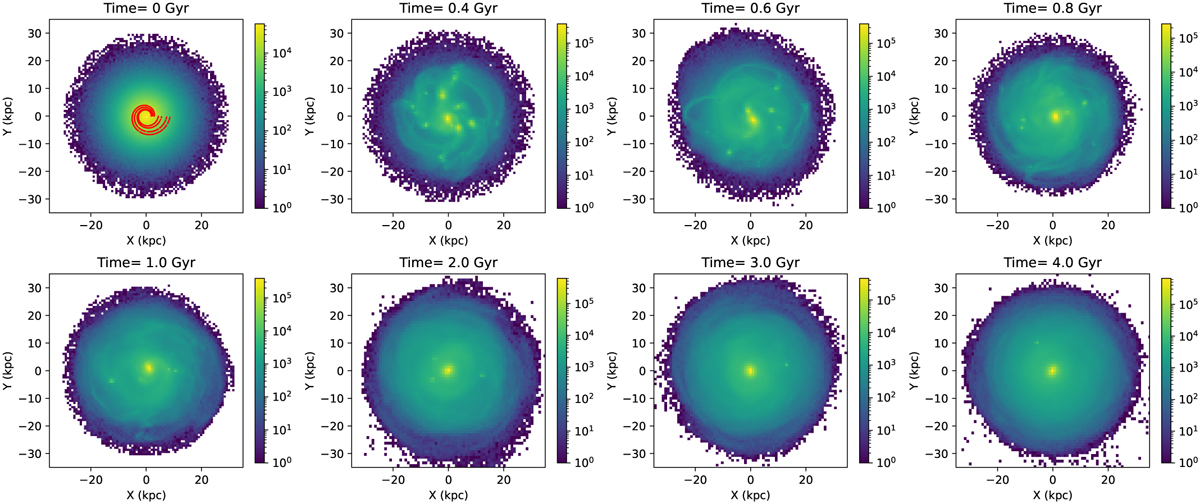
Snapshots of the disk from the face-on view. The upper left panel specifically depicts the distribution of massive, long-lasting particles within the IC (indicated by red dots), arranged in distinct spiral-like patterns. The snapshots presented in the other panels are derived from the “without-GMC” simulation (a simulation that does not include massive, long-lasting particles).
Current usage metrics show cumulative count of Article Views (full-text article views including HTML views, PDF and ePub downloads, according to the available data) and Abstracts Views on Vision4Press platform.
Data correspond to usage on the plateform after 2015. The current usage metrics is available 48-96 hours after online publication and is updated daily on week days.
Initial download of the metrics may take a while.