Fig. 8
Download original image
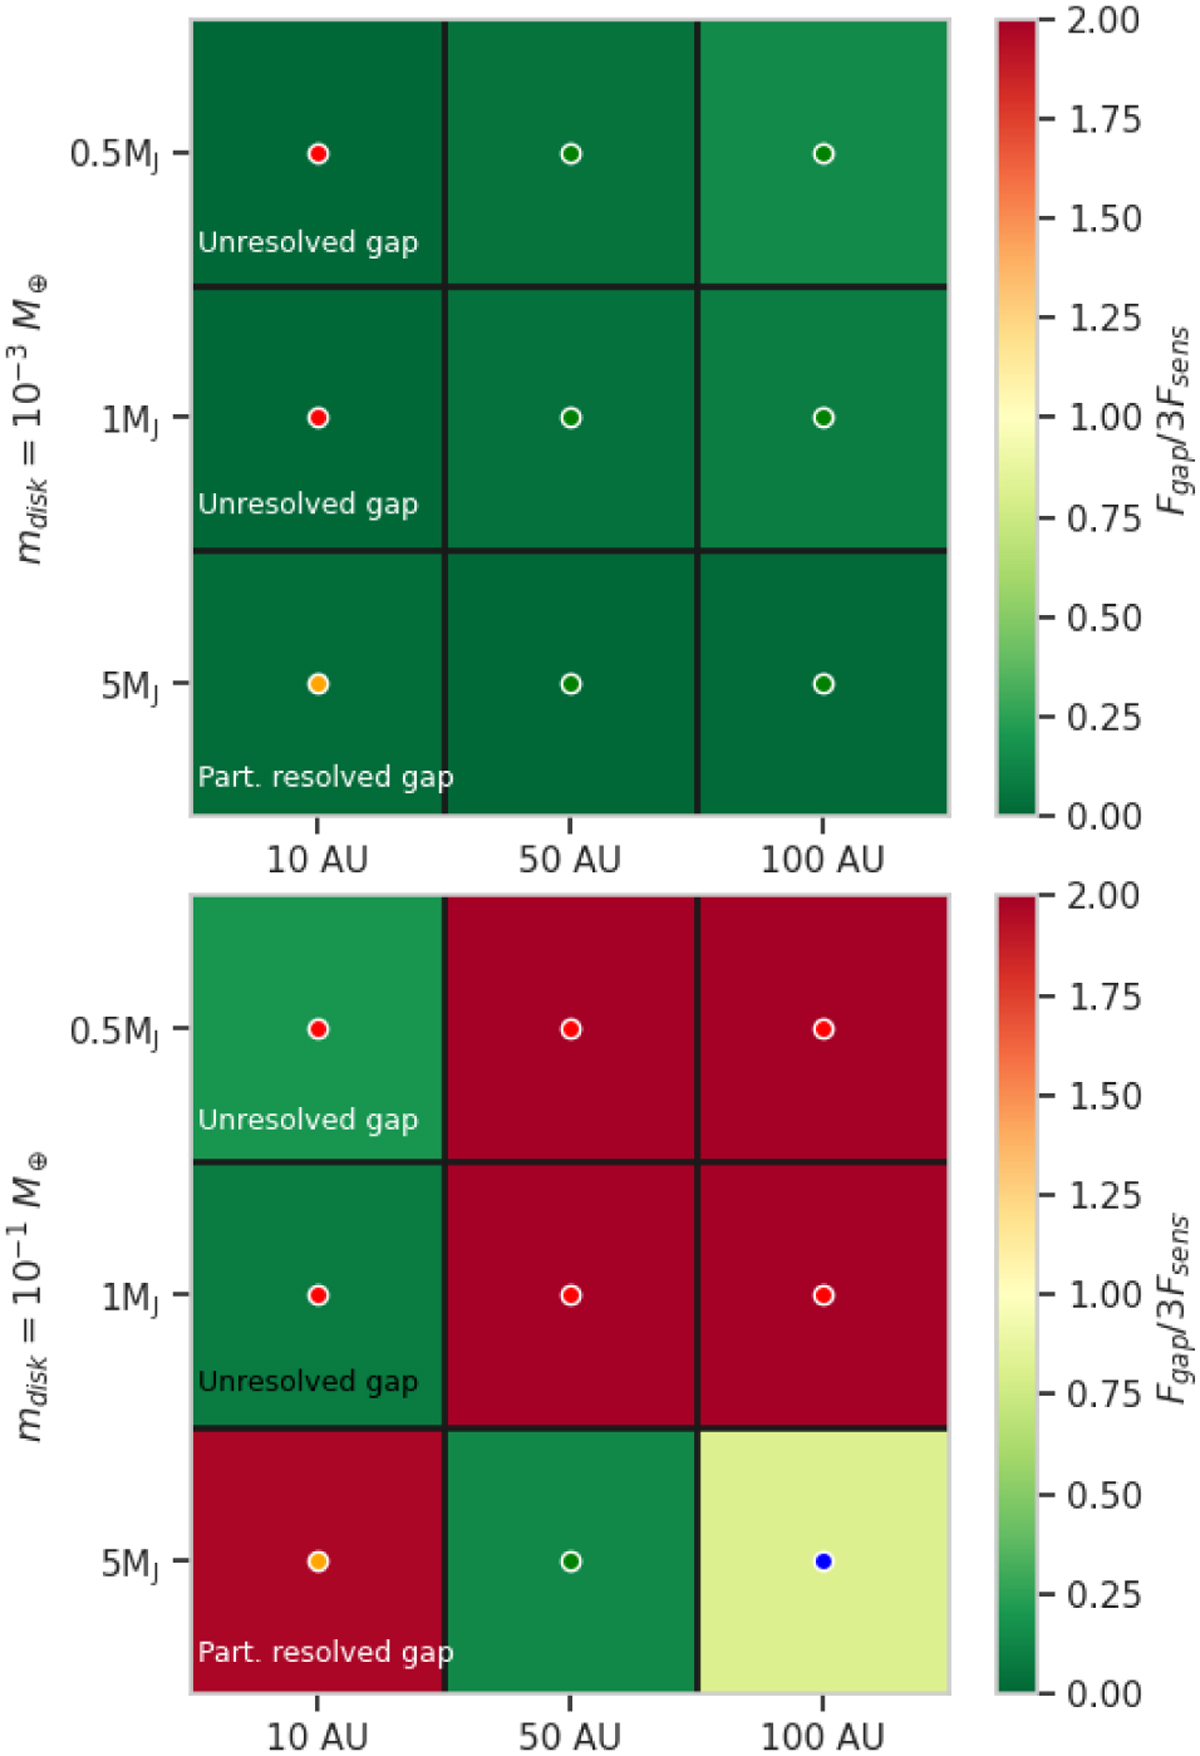
Value of our observability criterion Fɡap/(3Fsens) (color map) in different configurations explored. Here, the disks are located at 40 pc. Both disk masses are shown in the top (low-mass disk) and bottom (high-mass disk) squares. Each panel of each square represents a planetary configuration, with the planet mass increasing from top to bottom and its semi-major axis increasing from left to right. The dots represent whether we actually observe a gap (green if observed, red if not) in the simulated images presented in the previous sections. If our criterion works, then the color of the dot matches the color map. Here, we see that our criterion matches our simulated images quite well, with a few exceptions (see the text). Some gaps are either eccentric (orange dots) or observed but luminous (blue dot), which can complicate our analysis (see text).
Current usage metrics show cumulative count of Article Views (full-text article views including HTML views, PDF and ePub downloads, according to the available data) and Abstracts Views on Vision4Press platform.
Data correspond to usage on the plateform after 2015. The current usage metrics is available 48-96 hours after online publication and is updated daily on week days.
Initial download of the metrics may take a while.