Fig. 4
Download original image
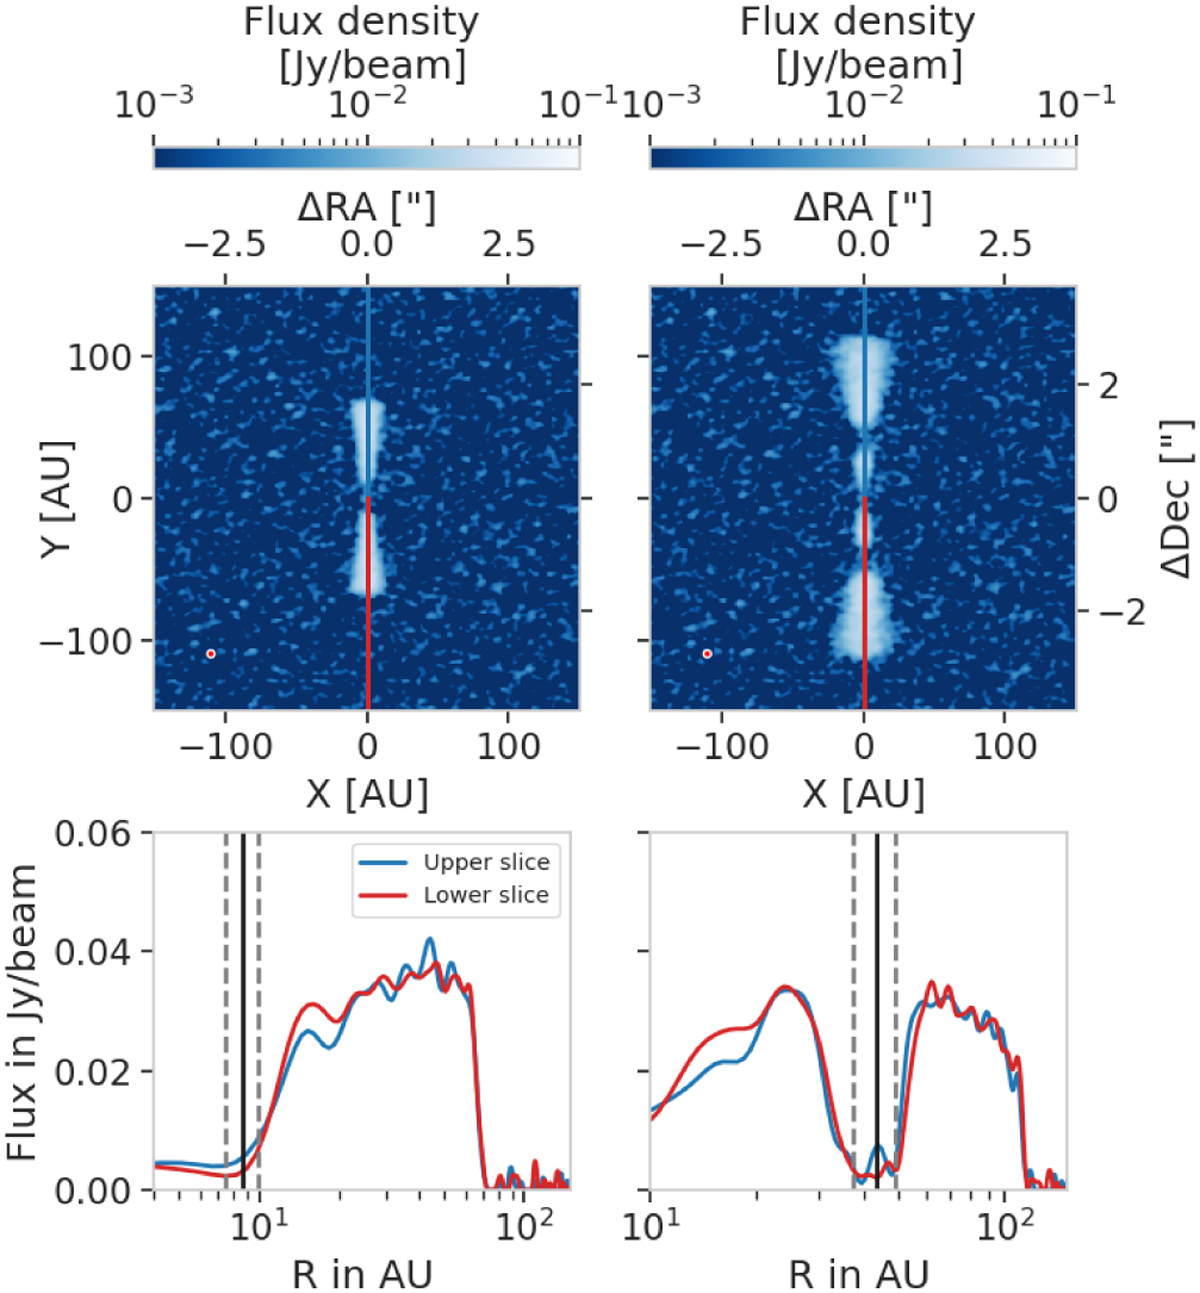
Channel maps at dv = 0.0 km/s (top panels) and two radial profiles of the gas emission along two radial axes (bottom panels). Here, the planet is mp = 1 MJ, located, respectively, at 10 AU (left column) and 50 AU (right column). The upper and lower slices are the radial profiles taken as shown in the images. The vertical black line shows the planet location, and the dashed gray lines are located at rp ± 2rH. Here, we clearly see that the gap is too close to the inner edge to be observed when the planet is located at 10 AU; however, the gap produced by the planet at 50 AU is wide and deep enough to be observed.
Current usage metrics show cumulative count of Article Views (full-text article views including HTML views, PDF and ePub downloads, according to the available data) and Abstracts Views on Vision4Press platform.
Data correspond to usage on the plateform after 2015. The current usage metrics is available 48-96 hours after online publication and is updated daily on week days.
Initial download of the metrics may take a while.