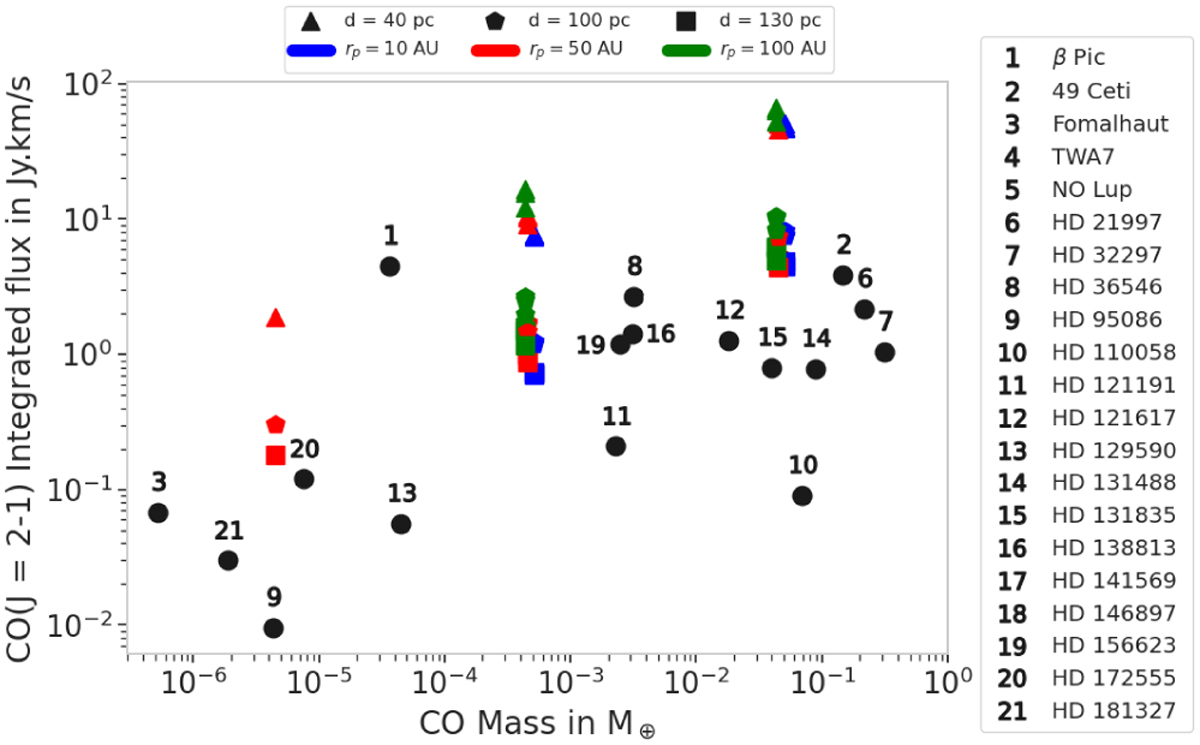
Fig. 2
Download original image
CO(J = 2−1) integrated fluxes as function of CO masses. The black dots represent the observations as in Fig. 1 and the colored symbols are derived from our simulations. The color represents the position of the planet and the symbols the distance of the disk. Our simulated disks are in line with the observed disks; the majority of them are located more than 100 pc away (cf. Fig. 1). We only show the disks in one planetary configuration for the low-mass disk case (mdisk = 10−5 M⊕) as the disks are difficult to observe at high angular resolution in this case.
Current usage metrics show cumulative count of Article Views (full-text article views including HTML views, PDF and ePub downloads, according to the available data) and Abstracts Views on Vision4Press platform.
Data correspond to usage on the plateform after 2015. The current usage metrics is available 48-96 hours after online publication and is updated daily on week days.
Initial download of the metrics may take a while.