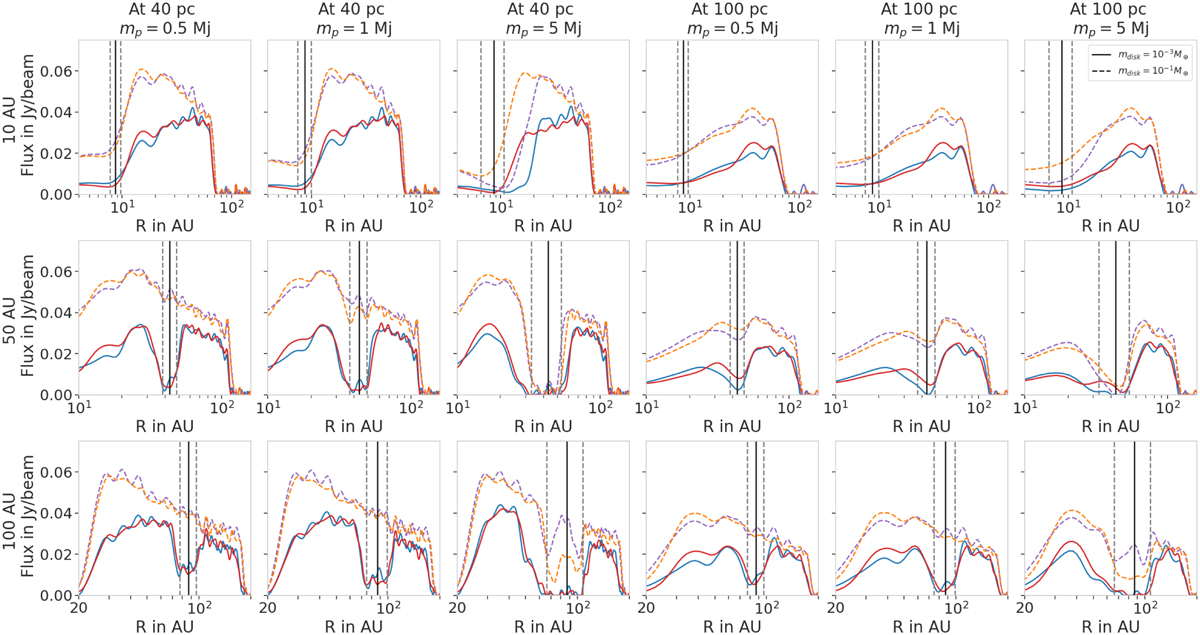
Fig. C.1
Download original image
Radial profiles along two axes as in Fig. 4 for all the planet configurations. The planet mass increases from left to right and the planet location increases from top to bottom. The first (resp. last) three columns show the profiles taken from the images of the disks located at 40 pc (resp. 100 pc). Both disk masses are over-plotted: the red and blue lines represent the low mass disks whereas the dashed orange and purple lines represent the high mass disks. The vertical black line shows the planet location (projected due to the disk’s inclination) and the vertical dashed gray lines show the gap width. Here, we clearly see that some gaps seen in the low mass disks are not visible in heavier disks.
Current usage metrics show cumulative count of Article Views (full-text article views including HTML views, PDF and ePub downloads, according to the available data) and Abstracts Views on Vision4Press platform.
Data correspond to usage on the plateform after 2015. The current usage metrics is available 48-96 hours after online publication and is updated daily on week days.
Initial download of the metrics may take a while.