Fig. B.1
Download original image
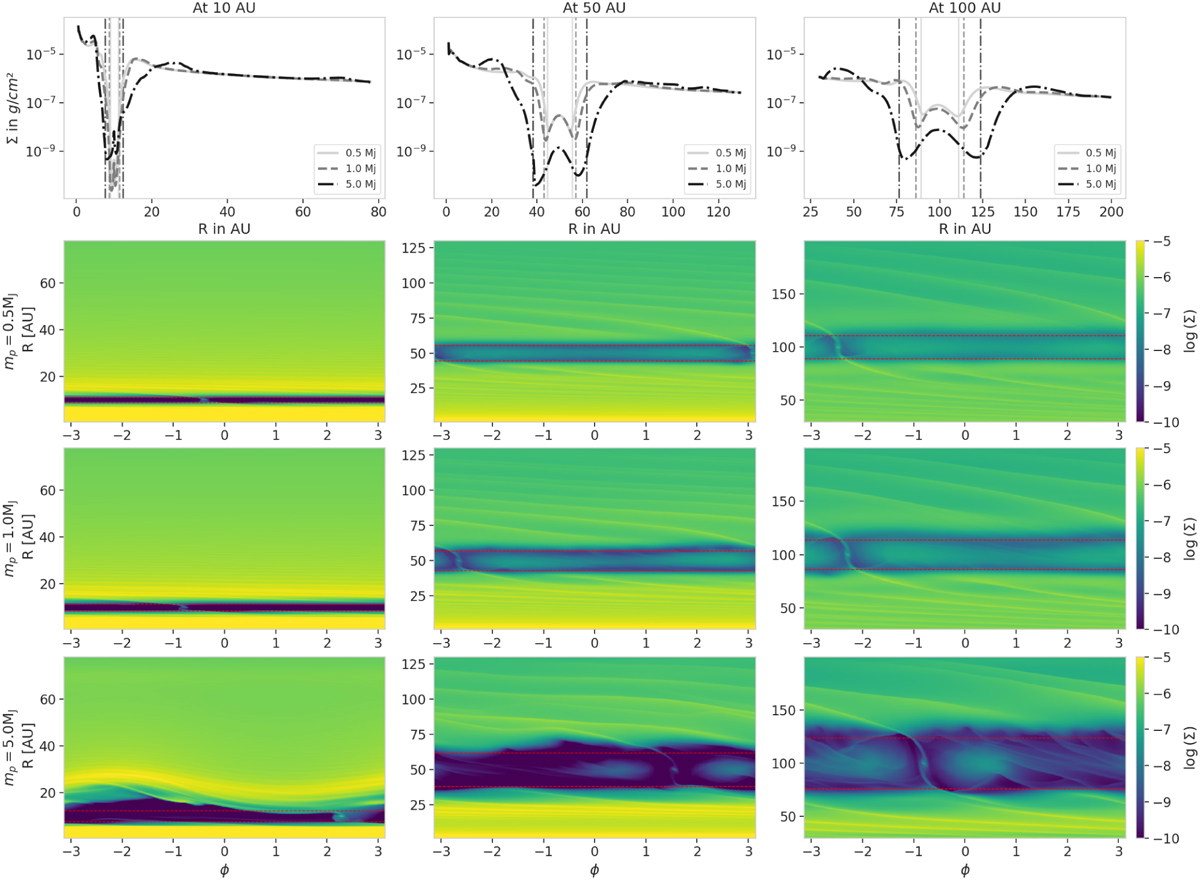
Surface density distributions of the gas in our hydrodynamical simulations. In the top row, we show the azimuthally averaged profiles for the planets located at 10AU (first column), 50AU (second column) and 100AU (third column). The color and style of the lines show the different planet masses. The vertical matching lines are located at rp ± 2rH in order to estimate the gap width. We clearly see that most massive planets produce deeper and wider gaps. The remaining panels show the 2D density maps for the different planet semi-major axes (columns) and masses (rows). The dashed red lines show again the gap width based on the planet’s Hill sphere. The 5 MJ planet located at 10AU produces an eccentric gap, which produces a less deep gap than in the circular cases.
Current usage metrics show cumulative count of Article Views (full-text article views including HTML views, PDF and ePub downloads, according to the available data) and Abstracts Views on Vision4Press platform.
Data correspond to usage on the plateform after 2015. The current usage metrics is available 48-96 hours after online publication and is updated daily on week days.
Initial download of the metrics may take a while.