Fig. 11
Download original image
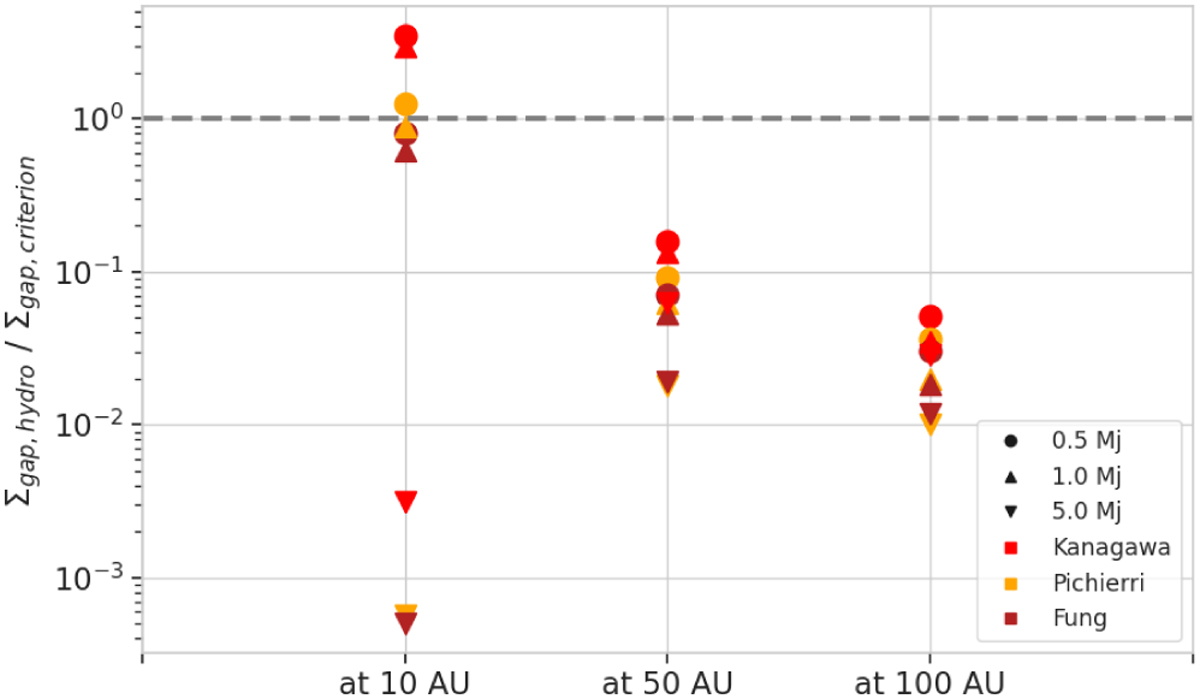
Ratio between averaged surface density inside the gaps in our hydrodynamical simulations ∑gap,hydro and the surface density estimated from different criteria ∑gap, criterion. In red are the estimates from Kanagawa et al. (2015), in orange those from Pichierri et al. (2023) and in brown those from Fung et al. (2014). Circles represent the cases where mp = 0.5 MJ, upward triangles are for mp = 1 MJ, and downward triangles are for mp = 5 MJ. We see that the different criteria fail to reproduce our gap depth the further away the planet is located. For the planet located at 10 AU, the criteria fail to reproduce the mp = 5 MJ case as the planets become eccentric, changing their gap opening.
Current usage metrics show cumulative count of Article Views (full-text article views including HTML views, PDF and ePub downloads, according to the available data) and Abstracts Views on Vision4Press platform.
Data correspond to usage on the plateform after 2015. The current usage metrics is available 48-96 hours after online publication and is updated daily on week days.
Initial download of the metrics may take a while.