Fig. 6.
Download original image
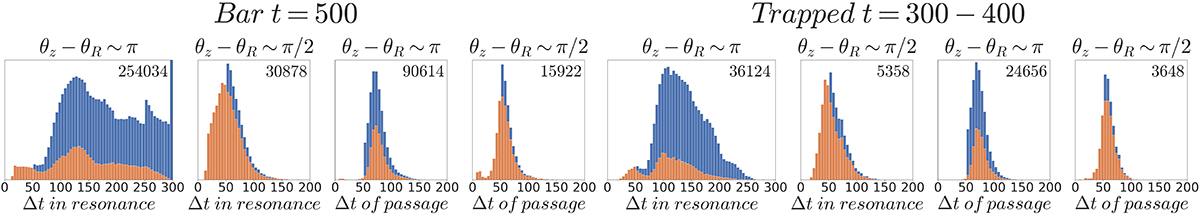
Distributions of the time that the bar (four left plots) and trapped (four right plots) orbits spend in resonance or pass through it, around the angles 0, π, and π/2, 3π/2. Orbits with resonant angles of 0, π are combined and are designated in the plots as θz − θR ∼ π. The same holds for the angles π/2, 3π/2. They are denoted as θz − θR ∼ π/2. The number of each type of orbit is indicated in the top right corner of each plot. The resonant and passing orbits are identified at t = 500, while the time interval t = 250 − 550 is being considered. The orange distributions correspond to orbits that enter and leave resonance or pass through it during this time period. The blue part of distributions corresponds to orbits that at the time t = 250 were already in resonance and/or were still in resonance at moment t = 550, and thus, they show a lower estimate for the time spent near the vILR.
Current usage metrics show cumulative count of Article Views (full-text article views including HTML views, PDF and ePub downloads, according to the available data) and Abstracts Views on Vision4Press platform.
Data correspond to usage on the plateform after 2015. The current usage metrics is available 48-96 hours after online publication and is updated daily on week days.
Initial download of the metrics may take a while.