Fig. 4.
Download original image
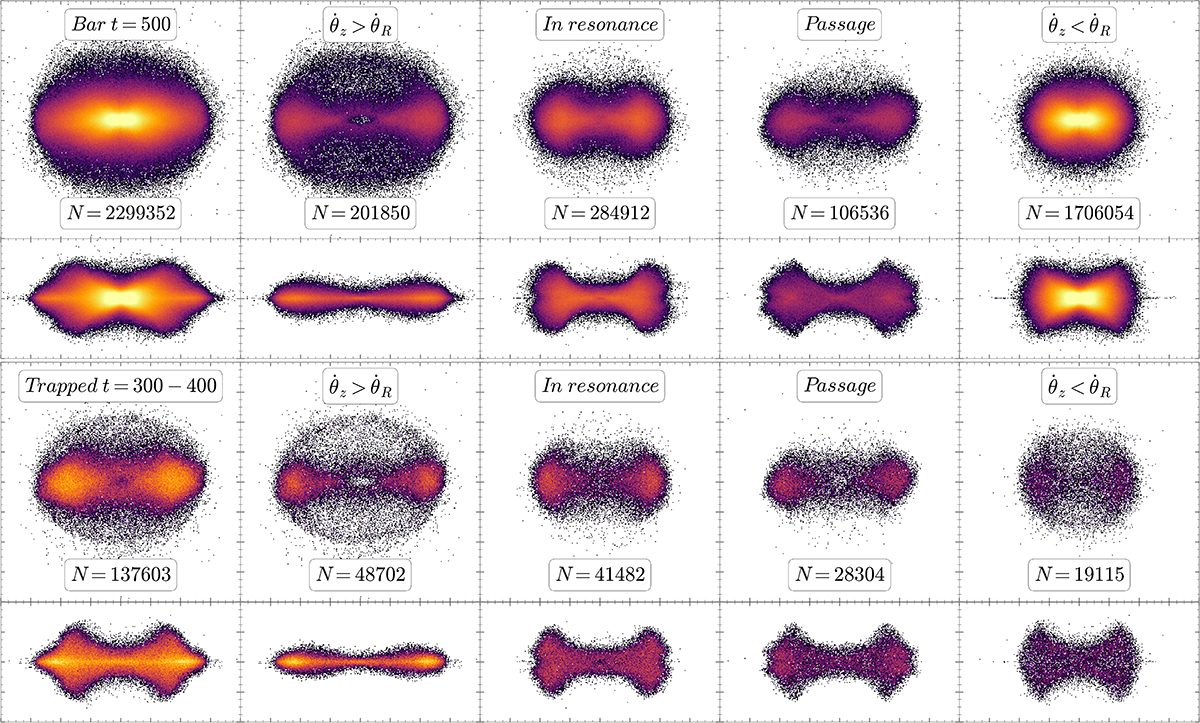
Snapshots (xy and xz) of the bar (top two rows) and the structure assembled from the orbits trapped into the bar in the time interval t = 300 − 400 (bottom two rows) at t = 500. The first column shows all orbits under consideration. Structures assembled from orbits that increased and decreased their resonant angle θz − θR are displayed in the second and fifth columns, respectively. The third and forth columns show orbits in the vILR and passing through it, respectively.
Current usage metrics show cumulative count of Article Views (full-text article views including HTML views, PDF and ePub downloads, according to the available data) and Abstracts Views on Vision4Press platform.
Data correspond to usage on the plateform after 2015. The current usage metrics is available 48-96 hours after online publication and is updated daily on week days.
Initial download of the metrics may take a while.