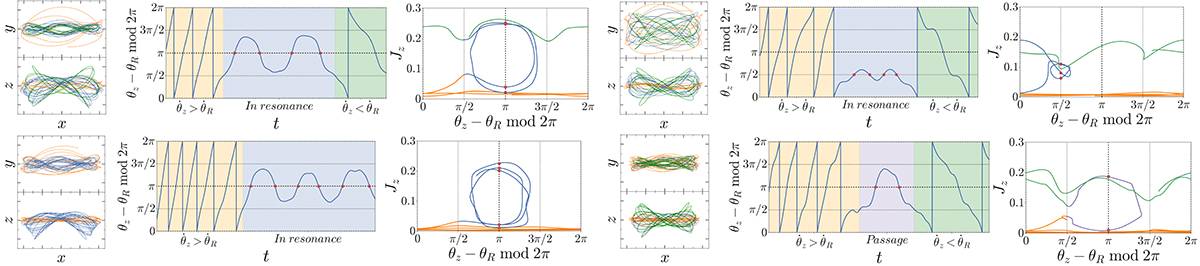
Fig. 3.
Download original image
Four examples of different orbital behaviors in our N-body simulations. For each orbit, from left to right, we show snapshots (xy and xz), the change in the resonant angle θz − θR with time, the orbit in the plane (θres, Jz), where Jz is the midterm vertical action. The top left and right orbits remain a long time in vILR and librate around θz − θR ∼ π (banana orbit) and π/2 (anti-banana orbit), respectively, and then leave it. The bottom right orbit is trapped into vILR and also librates around θz − θR ∼ π until the end of the integration time. The bottom left orbit passes through the resonance around θz − θR = π. Orange and green in each plot correspond to the time when θz − θR increases and decreases, respectively. Blue and purple correspond to the stage when the orbit is in resonance or passes through it, respectively.
Current usage metrics show cumulative count of Article Views (full-text article views including HTML views, PDF and ePub downloads, according to the available data) and Abstracts Views on Vision4Press platform.
Data correspond to usage on the plateform after 2015. The current usage metrics is available 48-96 hours after online publication and is updated daily on week days.
Initial download of the metrics may take a while.