Fig. 2.
Download original image
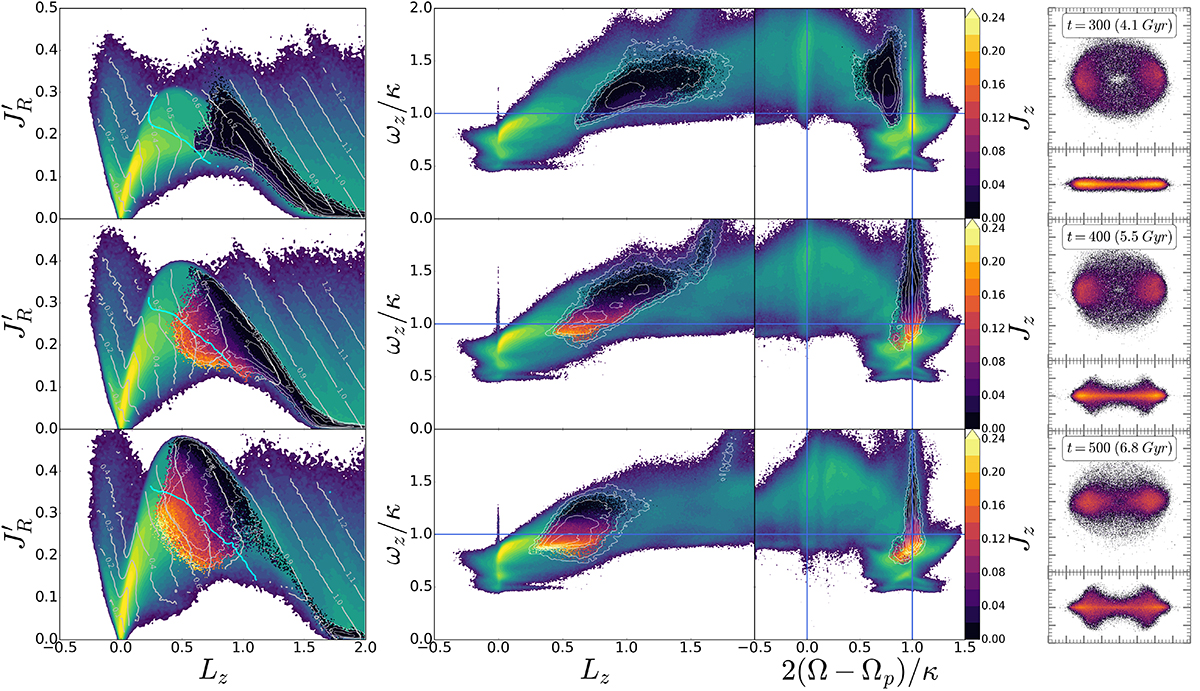
Vertical action and its evolution for captured orbits. Left and middle columns: 2D density maps (bar and disk) in the background and 2D maps (superimposed in the foreground) of Jz for orbits that were flat (Jz < 0.05) at t = 300 and trapped into the bar over the time interval of t = 300 − 400. Different time moments are shown from top to bottom, t = 300 (top row), 400 (middle row), and 500 (bottom row). The thin gray lines in each plot represent the isodensity contours of trapped orbits. In the left column, the thick gray lines correspond to isolines of the same value of the adiabatic invariant Jv = JR′+Jz + Lz/2, and the thick cyan line corresponds to the frequency ratio isoline ωz/κ = 1. The vertical blue lines in the middle column indicate the location of the CR and ILR. Right column: Snapshots (xy and xz) of the trapped orbits at the corresponding time moments.
Current usage metrics show cumulative count of Article Views (full-text article views including HTML views, PDF and ePub downloads, according to the available data) and Abstracts Views on Vision4Press platform.
Data correspond to usage on the plateform after 2015. The current usage metrics is available 48-96 hours after online publication and is updated daily on week days.
Initial download of the metrics may take a while.