Fig. 1.
Download original image
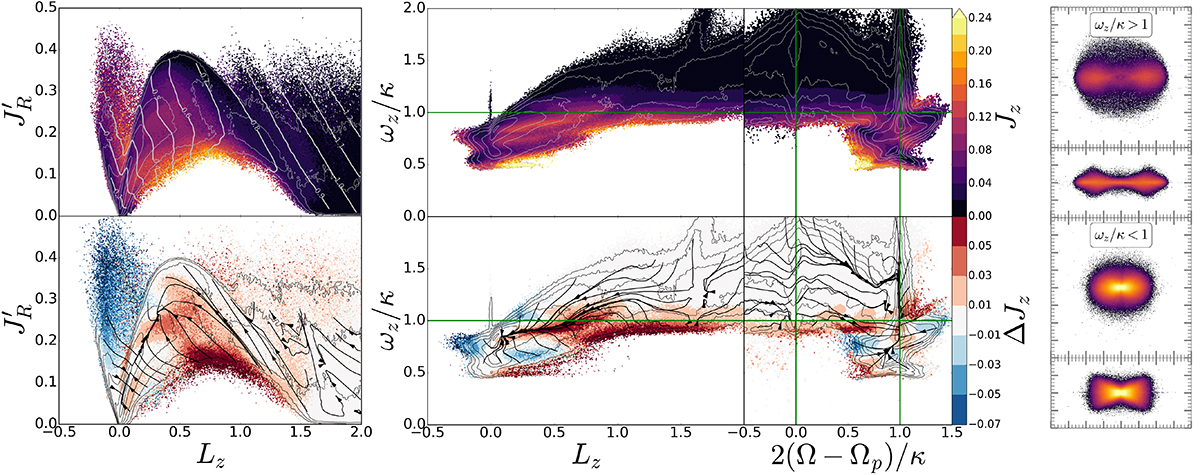
Vertical action and its evolution. Left and middle columns: 2D maps of the vertical action Jz plotted in different coordinates, (Lz, JR′=JR − θ(−Lz)Lz) (first column), (Lz, ωz/κ) (second column), and (2(Ω − Ωp)/κ, ωz/κ) (third column). Top row: Average value of the action in the pixel. Bottom row: Mean changes in Jz from t = 300 to t = 400 (actions and frequencies refer to the moment t = 400). The vector fields in the bottom rows demonstrate the average flow of orbits in given planes over five time units (from 400 to 405). The thin gray lines in each plot represent isodensity contours. The thick gray lines in the top left plot correspond to the lines with the same value of the adiabatic invariant Jv = JR′+Jz + Lz/2. The vertical green lines in the middle column indicate the location of the CR and ILR. Right column: Snapshots (xy and xz) of the bar orbits (abnormal orbits; see Zozulia et al. 2024) at t = 400 with different frequency ratios ωz/κ > 1 (top two plots) and ωz/κ < 1 (bottom two plots).
Current usage metrics show cumulative count of Article Views (full-text article views including HTML views, PDF and ePub downloads, according to the available data) and Abstracts Views on Vision4Press platform.
Data correspond to usage on the plateform after 2015. The current usage metrics is available 48-96 hours after online publication and is updated daily on week days.
Initial download of the metrics may take a while.