Fig. 5.
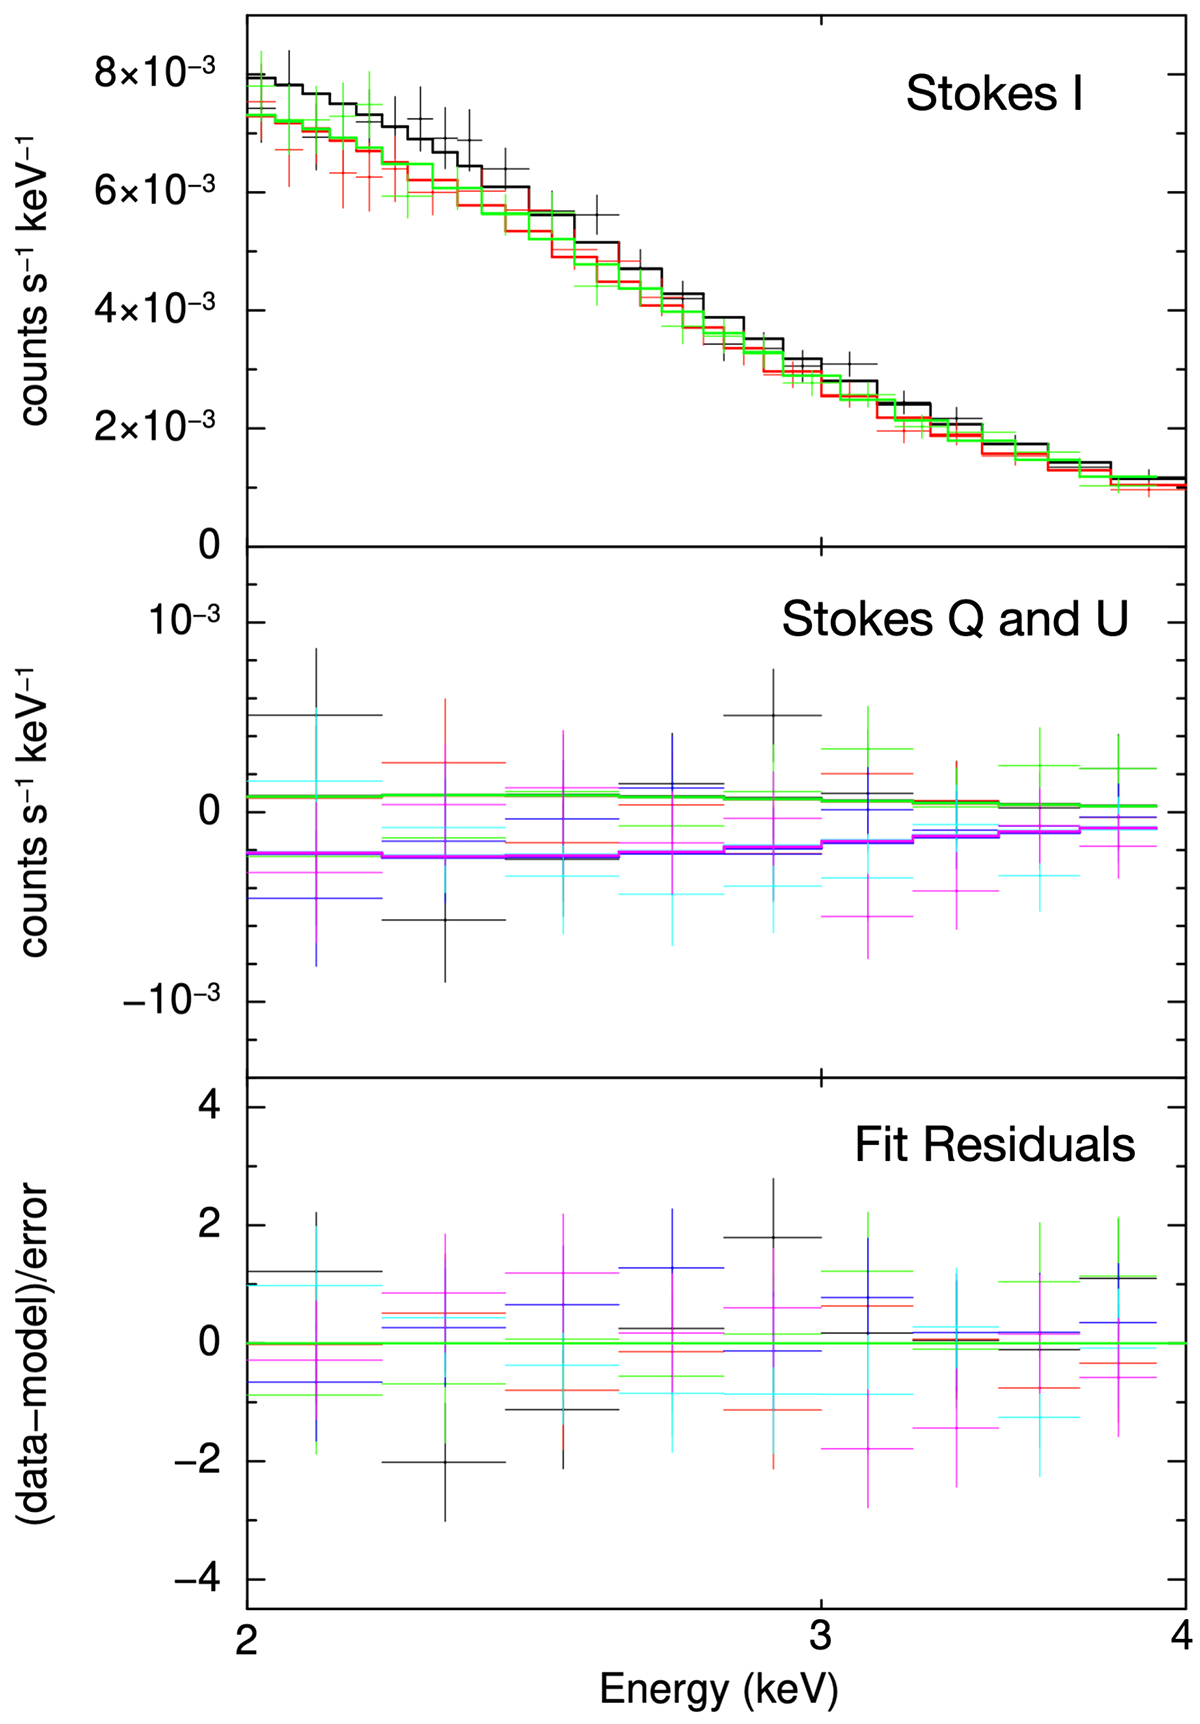
Download original image
Stokes I, Q, and U spectra of three DUs extracted from the source region with background subtraction (denoted in Figure 1). The three Stokes I spectra (DU1 in black, DU2 in red, DU3 in green) are shown in the upper panel. The six Stokes Q spectra (DU1 in black, DU2 in red, DU3 in green) and U spectra (DU1 in blue, DU2 in light blue, DU3 in magenta) are displayed in the middle panel. It appears that only two model lines (for Q and U spectra) are visible in this panel because the differences between the model lines for the three DUs are too small to be shown. The lower panel shows the fit residuals as (data − model)/ error.
Current usage metrics show cumulative count of Article Views (full-text article views including HTML views, PDF and ePub downloads, according to the available data) and Abstracts Views on Vision4Press platform.
Data correspond to usage on the plateform after 2015. The current usage metrics is available 48-96 hours after online publication and is updated daily on week days.
Initial download of the metrics may take a while.