Fig. 9.
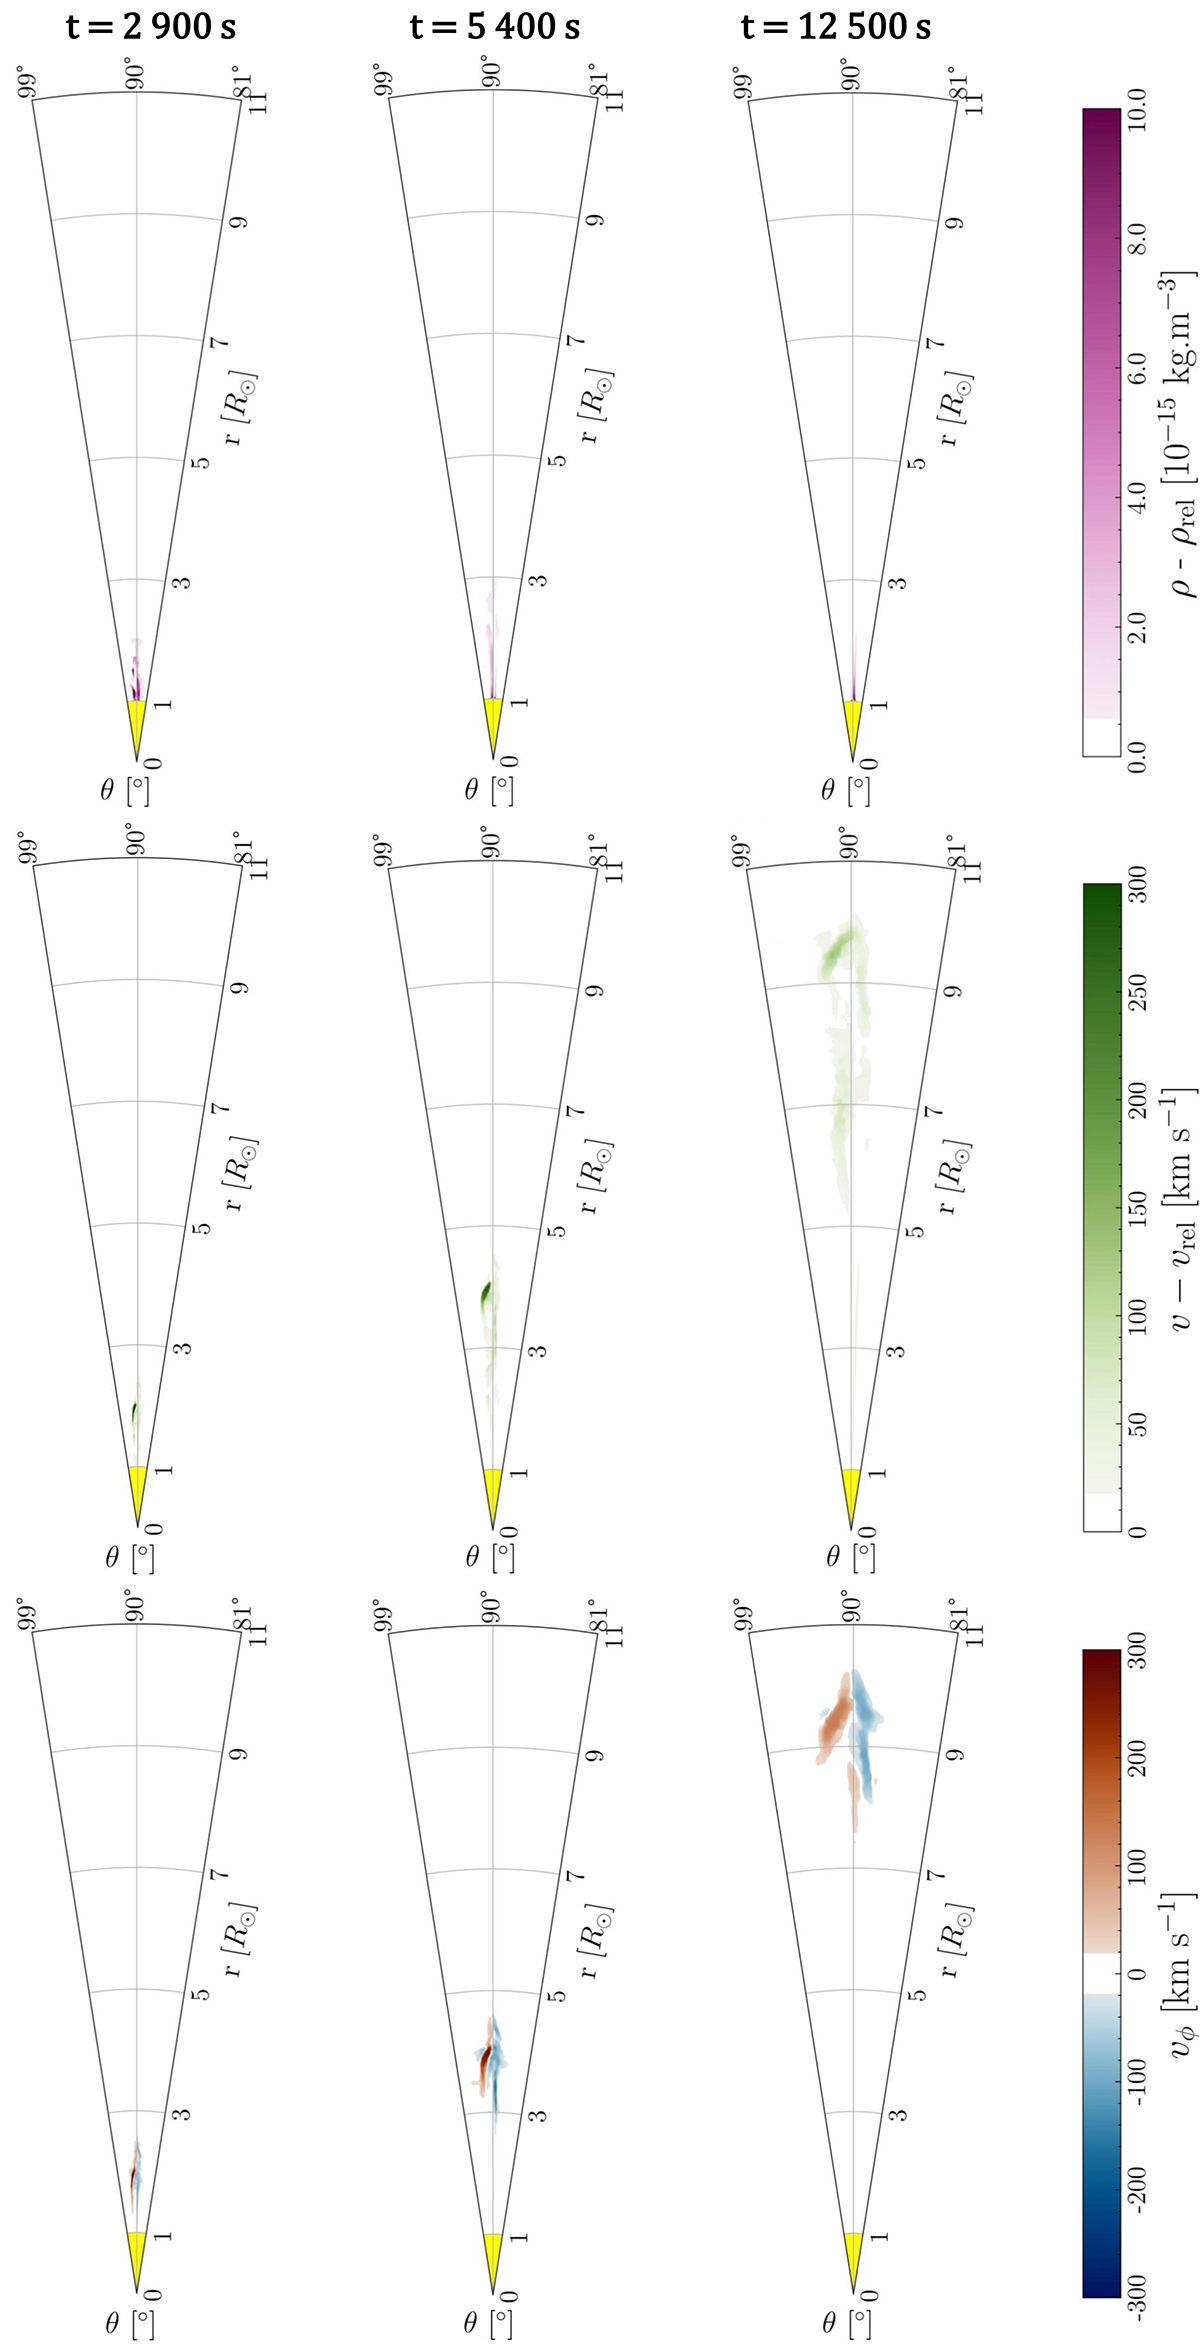
Download original image
2D cuts at ϕ = 0° of the evolution of selected quantities in Hβ at t = 2900 s, t = 5400 s, and t = 12 500 s: mass density variations, ρ − ρrel (top row panels), velocity variations v − vrel (middle row panels), and ϕ velocity component, vϕ (bottom row panels), perpendicular to the plane of the cut with blue (respectively red) colour scales indicating observer-directed (respectively oppositely directed) velocities. An animation of this figure is available online.
Current usage metrics show cumulative count of Article Views (full-text article views including HTML views, PDF and ePub downloads, according to the available data) and Abstracts Views on Vision4Press platform.
Data correspond to usage on the plateform after 2015. The current usage metrics is available 48-96 hours after online publication and is updated daily on week days.
Initial download of the metrics may take a while.