Fig. 5.
Download original image
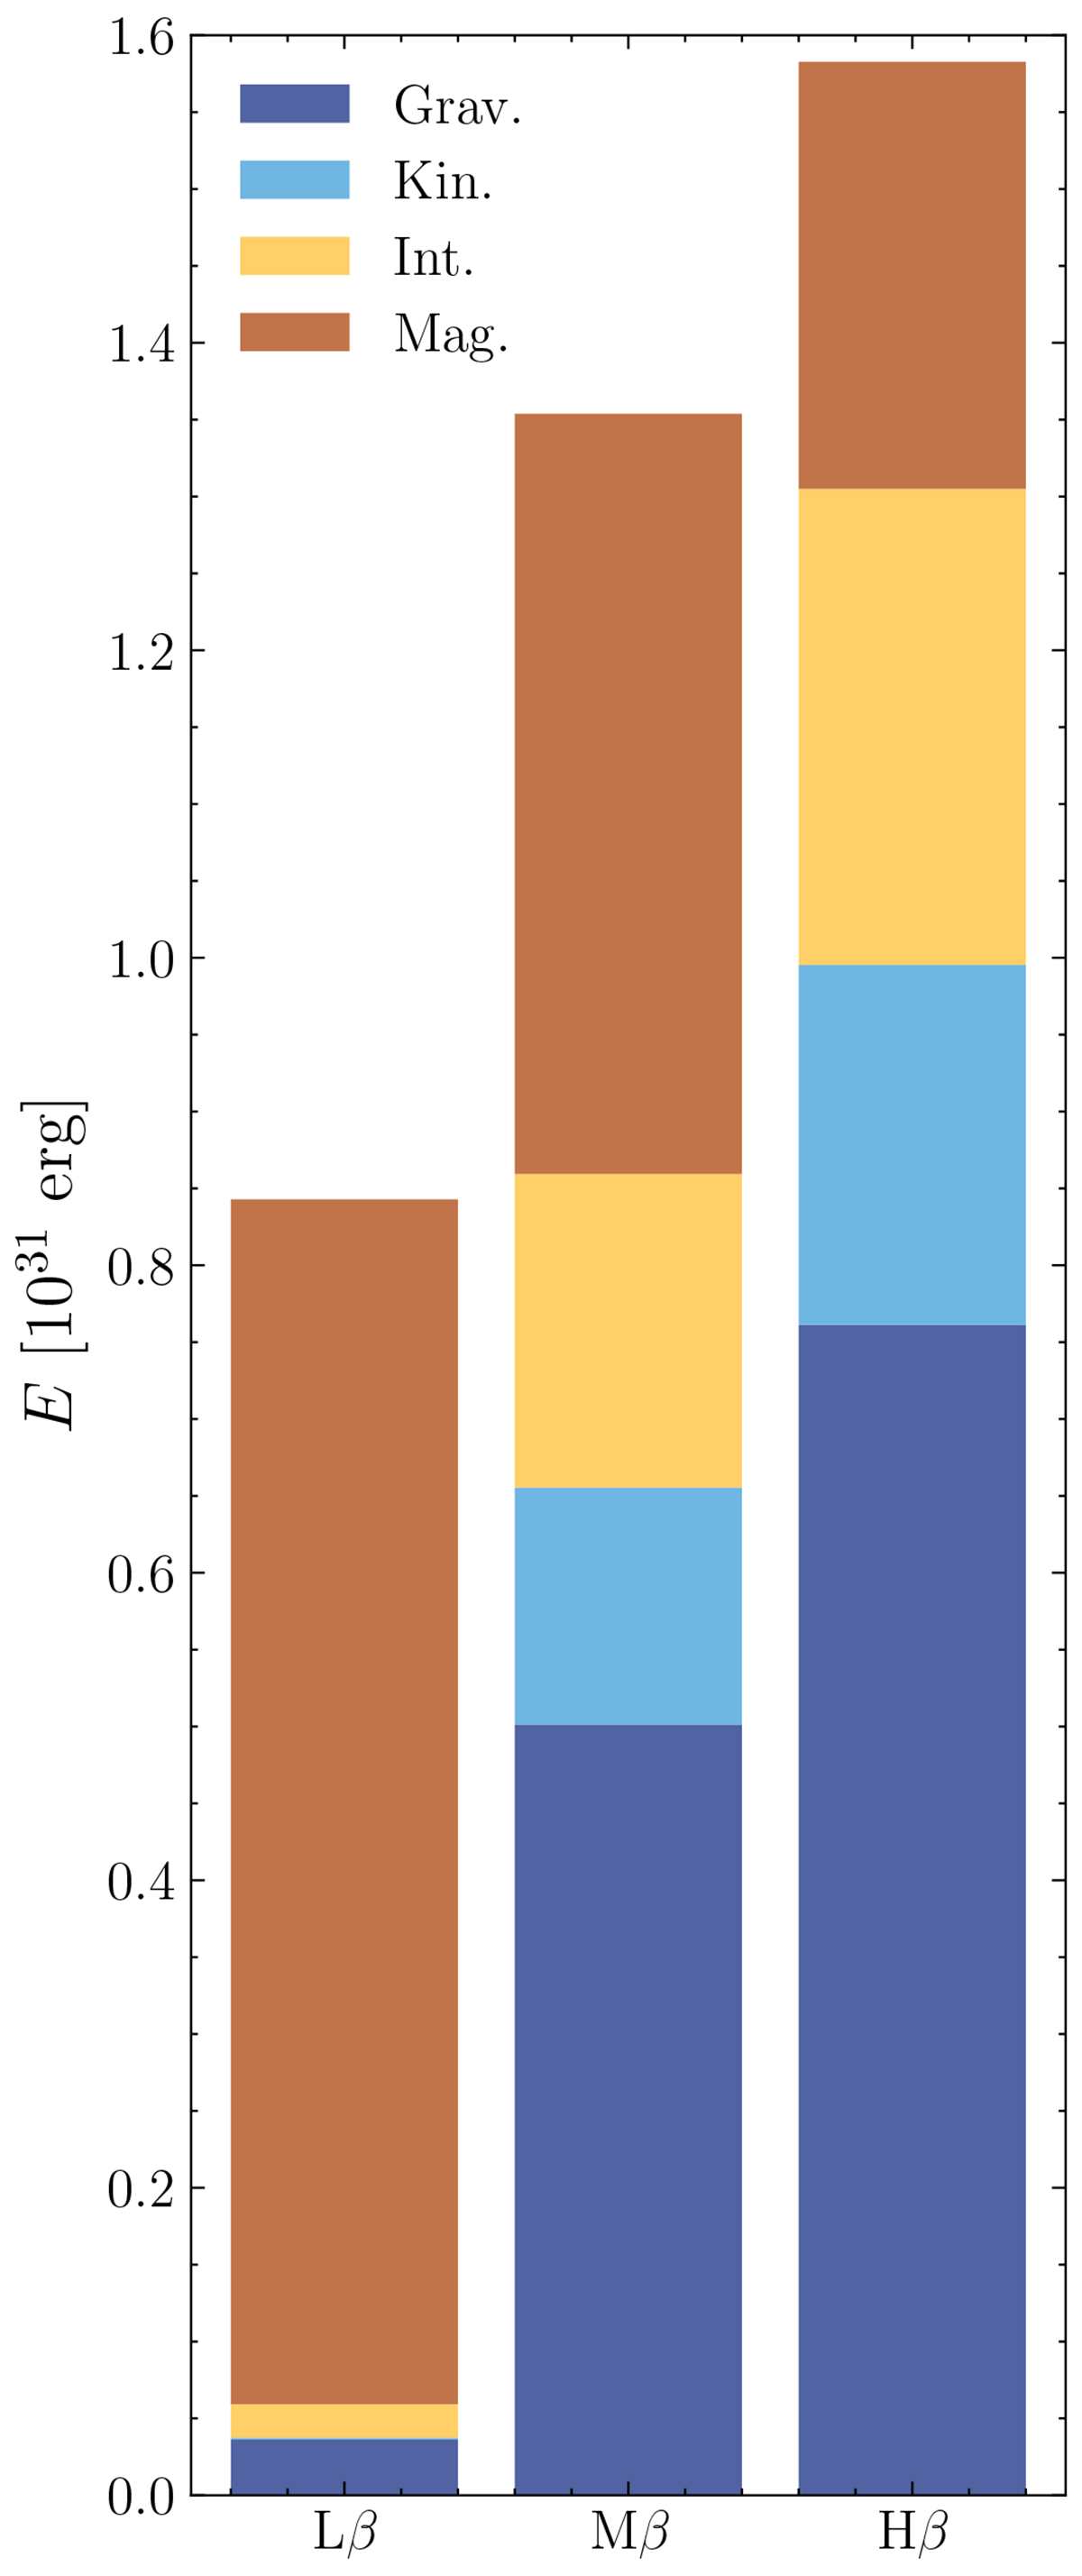
Stacked bar chart illustrating the distribution of energy components defined by Eqs. (4)–(7): gravitational (indigo), kinetic (blue), internal (yellow), and magnetic (orange) for the three simulations. Each bar represents the aggregated energy budget for a specific simulation, where different colours denote the contributions of the respective energy components.
Current usage metrics show cumulative count of Article Views (full-text article views including HTML views, PDF and ePub downloads, according to the available data) and Abstracts Views on Vision4Press platform.
Data correspond to usage on the plateform after 2015. The current usage metrics is available 48-96 hours after online publication and is updated daily on week days.
Initial download of the metrics may take a while.