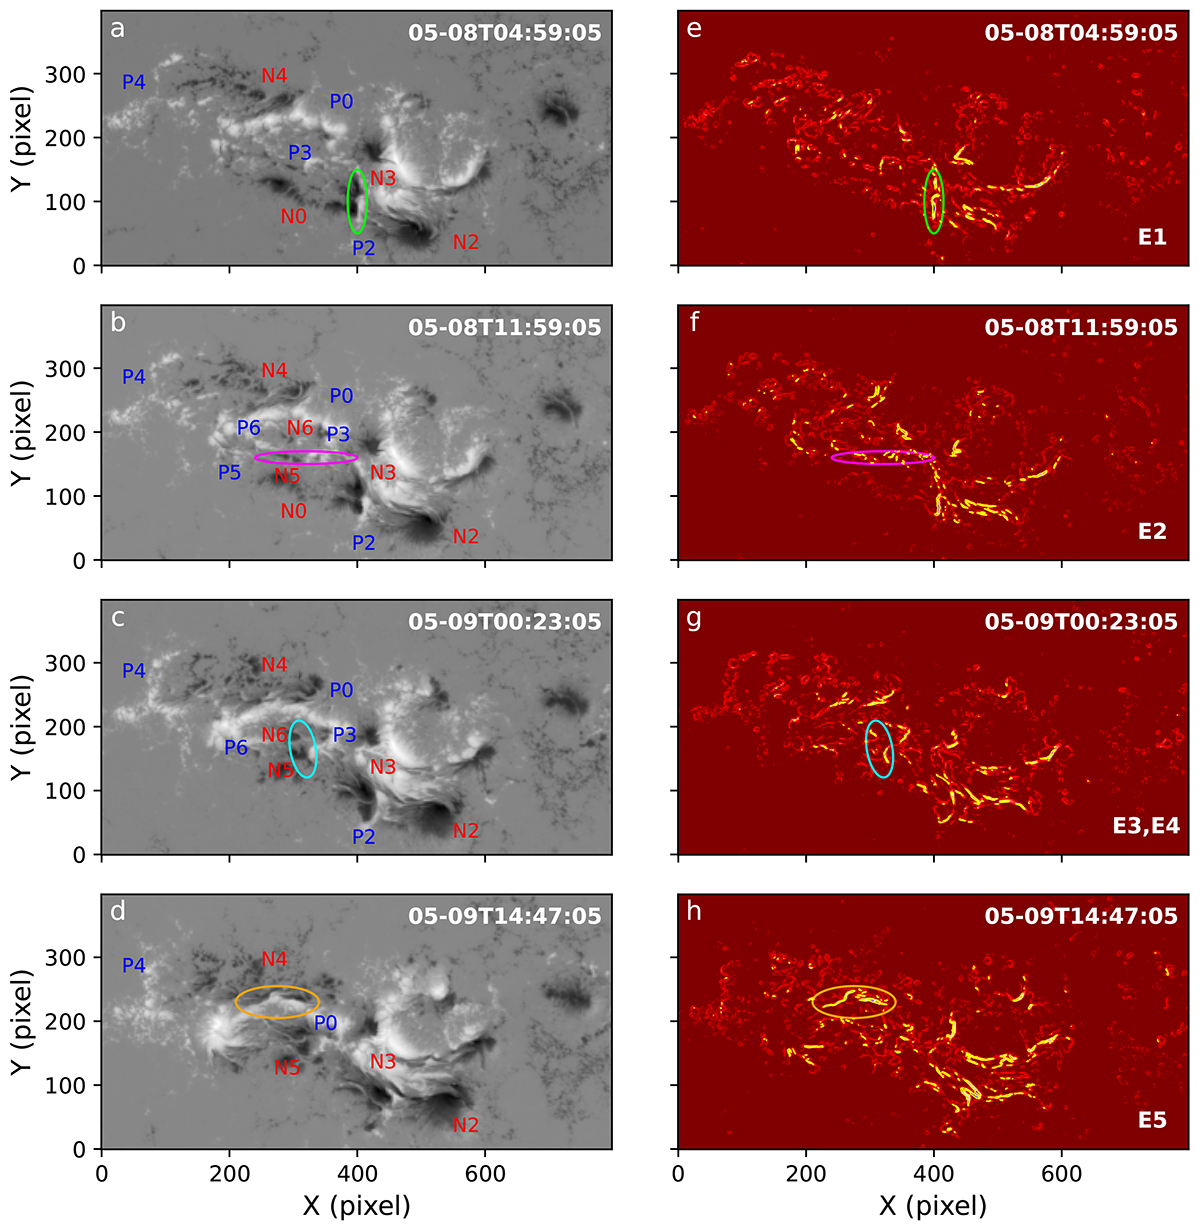
Fig. 3.
Download original image
Br magnetograms (a-d) and their corresponding gradient maps (e-h) at sequential times. The color eclipses indicates the CME source regions. We show the dipolar magnetic fields. The yellow contours in (e-h) represent a strong gradient (≥1000 G Mm−1). The left and right columns correspond to two separate animations. A five-day animation of the magnetograms and gradient maps is available as an online movie, starting on 2024 May 4, 23:59 UT, and ending on 2024 May 9, 23:47 UT.
Current usage metrics show cumulative count of Article Views (full-text article views including HTML views, PDF and ePub downloads, according to the available data) and Abstracts Views on Vision4Press platform.
Data correspond to usage on the plateform after 2015. The current usage metrics is available 48-96 hours after online publication and is updated daily on week days.
Initial download of the metrics may take a while.