Open Access
Fig. 1.
Download original image
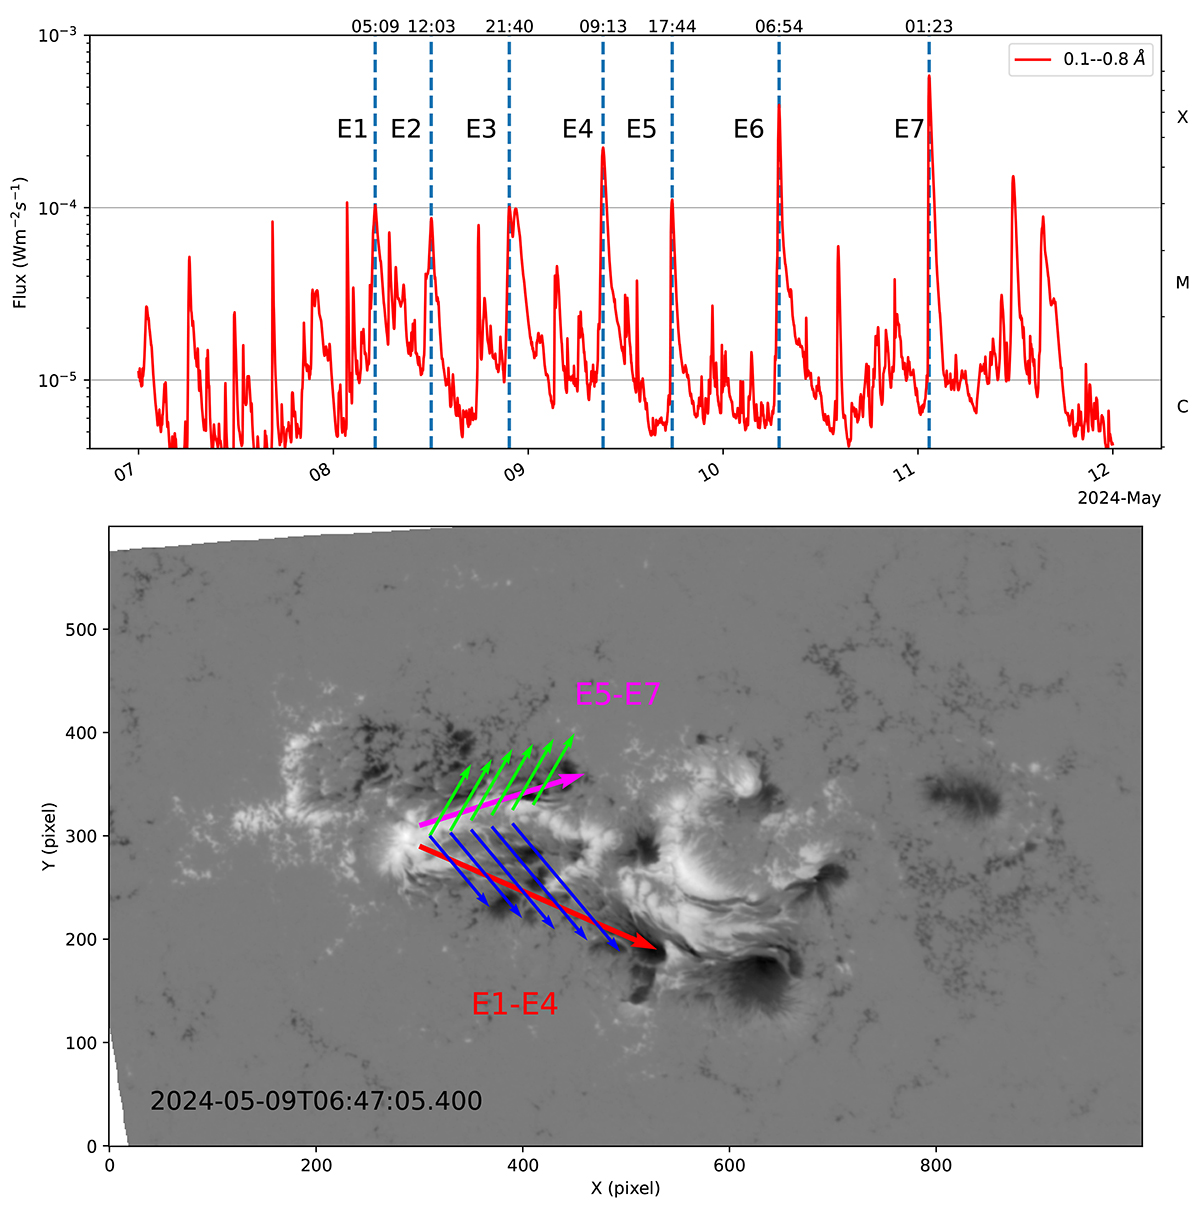
Overview of GOES 1–8 Å flux (top) and AR 13664/8 (bottom). The vertical dashed blue lines show the flare peak times. The arrows indicate the axial fields of potential MFR structures along different PILs (red and purple), with reverse azimuthal fields (blue and green).
Current usage metrics show cumulative count of Article Views (full-text article views including HTML views, PDF and ePub downloads, according to the available data) and Abstracts Views on Vision4Press platform.
Data correspond to usage on the plateform after 2015. The current usage metrics is available 48-96 hours after online publication and is updated daily on week days.
Initial download of the metrics may take a while.