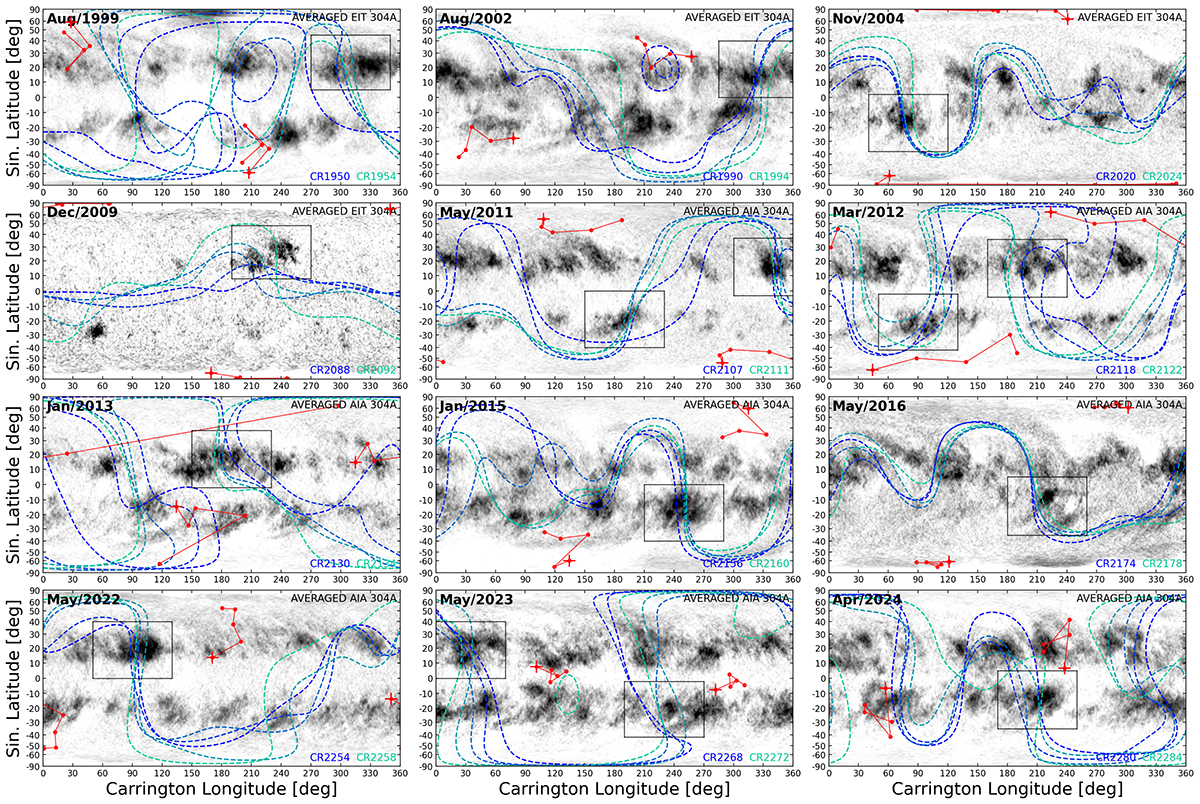
Fig. B.1.
Download original image
Identification of nested active regions. Each panel corresponds to one of the horizontal bars from Fig. 1, i.e. an epoch of stalling in the reversal of the Sun’s dipole magnetic field. Data are combined from five CRs during each period, in a similar manner as for Figs. 2-4, to highlight regions with persistent EUV emission (background grey-scale) that restrict the position of the HCS (dashed coloured lines) and motion of the dipole axis (connected red dots). Black boxes highlight regions with repeated flux emergence that anchor the HCS above them.
Current usage metrics show cumulative count of Article Views (full-text article views including HTML views, PDF and ePub downloads, according to the available data) and Abstracts Views on Vision4Press platform.
Data correspond to usage on the plateform after 2015. The current usage metrics is available 48-96 hours after online publication and is updated daily on week days.
Initial download of the metrics may take a while.