Fig. 5.
Download original image
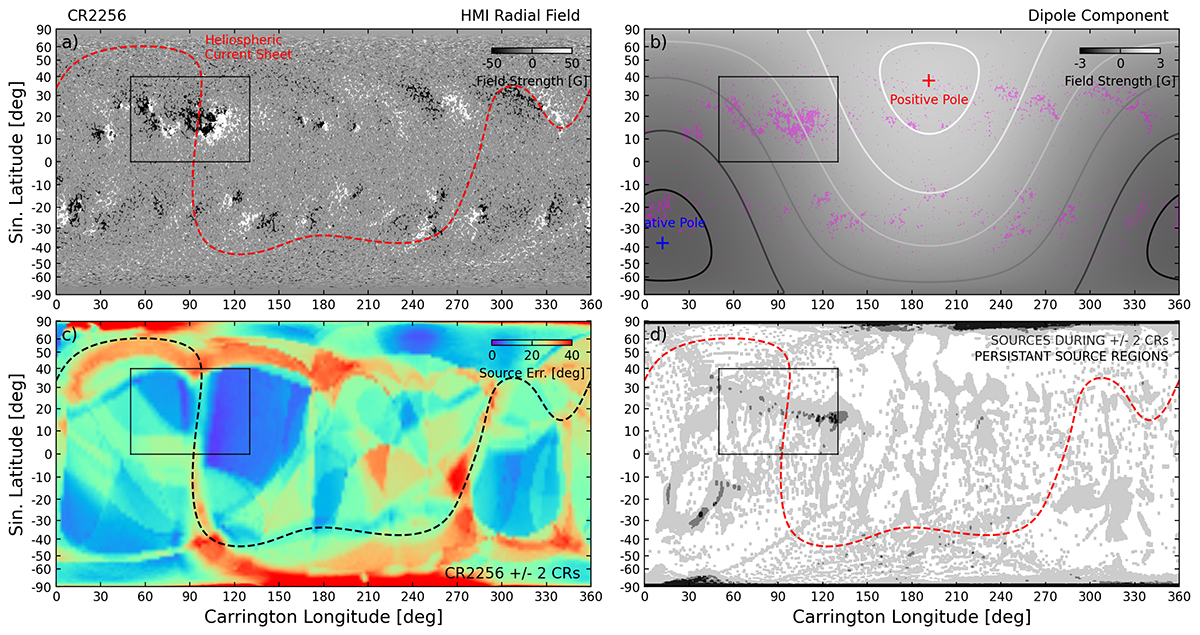
Solar wind connectivity for CR 2256 with the nested active region from Fig. 2. Panel a: Photospheric magnetic field with the HCS (in red) and a box highlighting the area of interest. Panel b: Dipole component of the photospheric magnetic field from the spherical harmonic decomposition, along with the location of the dipole axis and strong field regions from panel a in magenta. Panel c: Variation in source location when back-mapping through PFSS models between five magnetograms spanning from two CRs before to two CRs after CR 2256. Panel d: All the solar wind sources during the five consecutive CRs (in grey) and persistent source regions across all CRs (in black).
Current usage metrics show cumulative count of Article Views (full-text article views including HTML views, PDF and ePub downloads, according to the available data) and Abstracts Views on Vision4Press platform.
Data correspond to usage on the plateform after 2015. The current usage metrics is available 48-96 hours after online publication and is updated daily on week days.
Initial download of the metrics may take a while.