Fig. 2.
Download original image
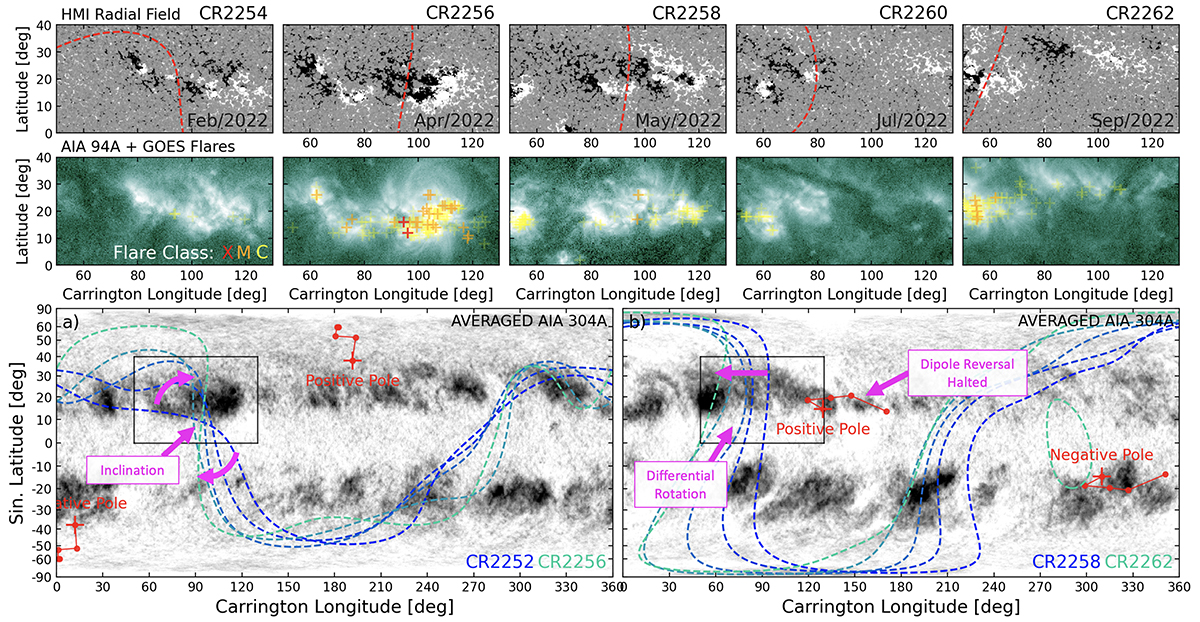
Magnetic field and activity evolution of a long-lived nested active region spanning from January 2022 to October 2022. Top two rows: Five snapshots of the HMI radial magnetic field and AIA 94 Å emission, with each snapshot taken two CRs apart. The dashed red line over the magnetic field shows the location of the HCS at the top of the PFSS extrapolation. Crosses over the EUV emission show the location of flares detected by GOES, and their associated magnitudes are distinguished by colour. Panel a: CRs 2252 to 2256. Panel b: CRs 2258 to 2262. The background of panels a and b displays the average 304 Å emission from five consecutive Carrington maps (each spanning one solar rotation), with darker tones indicating more intense emission. A solid black rectangle shows the selected area from the snapshots above. The evolution of the dipole axis is shown with connected red dots that track the position of the positive and negative poles. The crossed dot indicates the final position in the sequence. Dashed coloured lines follow the evolution of the HCS in time, moving from blue to green. Panel a focuses on the emergence phase and panel b the subsequent decay and differential rotation of the region.
Current usage metrics show cumulative count of Article Views (full-text article views including HTML views, PDF and ePub downloads, according to the available data) and Abstracts Views on Vision4Press platform.
Data correspond to usage on the plateform after 2015. The current usage metrics is available 48-96 hours after online publication and is updated daily on week days.
Initial download of the metrics may take a while.