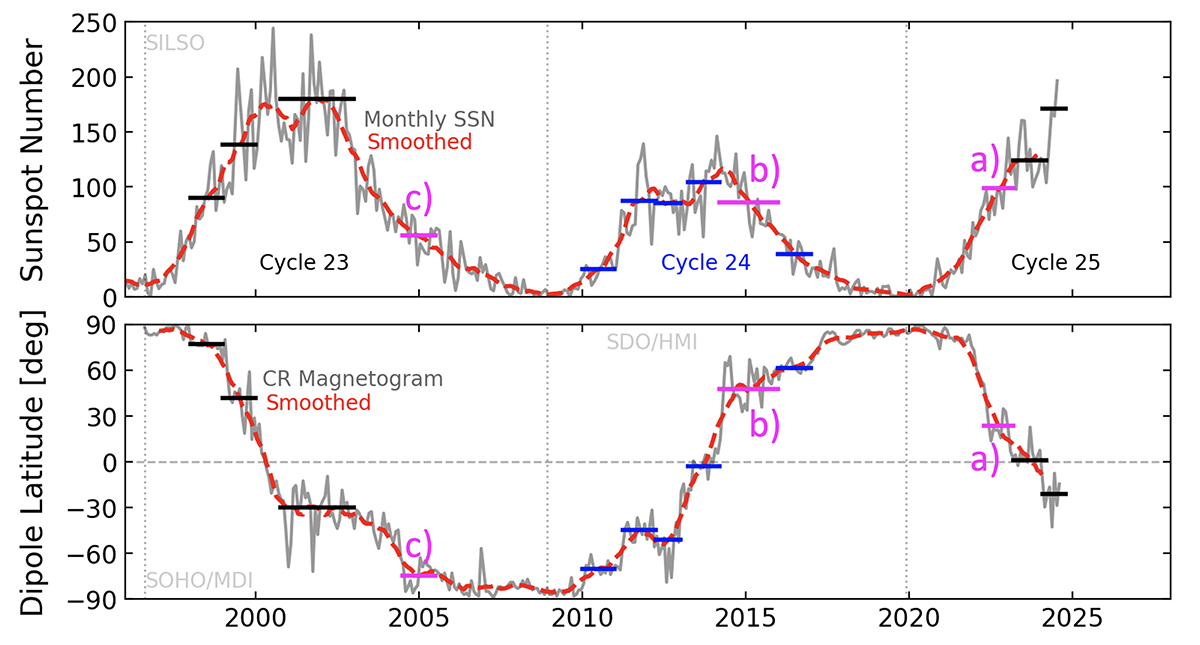
Fig. 1.
Download original image
Time series of the sunspot number and positive dipole axis latitude since the beginning of sunspot cycle 23. The solid grey lines have a monthly, or CR, cadence. The dashed red lines show the 13-month smoothed version of each time series. The start times of sunspot cycles 23, 24, and 25 are identified with dotted vertical lines. Horizontal bars indicate when the reversal of the dipole component is halted for several solar rotations. The magenta bars labelled (a), (b), and (c) are discussed in Sect. 3.
Current usage metrics show cumulative count of Article Views (full-text article views including HTML views, PDF and ePub downloads, according to the available data) and Abstracts Views on Vision4Press platform.
Data correspond to usage on the plateform after 2015. The current usage metrics is available 48-96 hours after online publication and is updated daily on week days.
Initial download of the metrics may take a while.