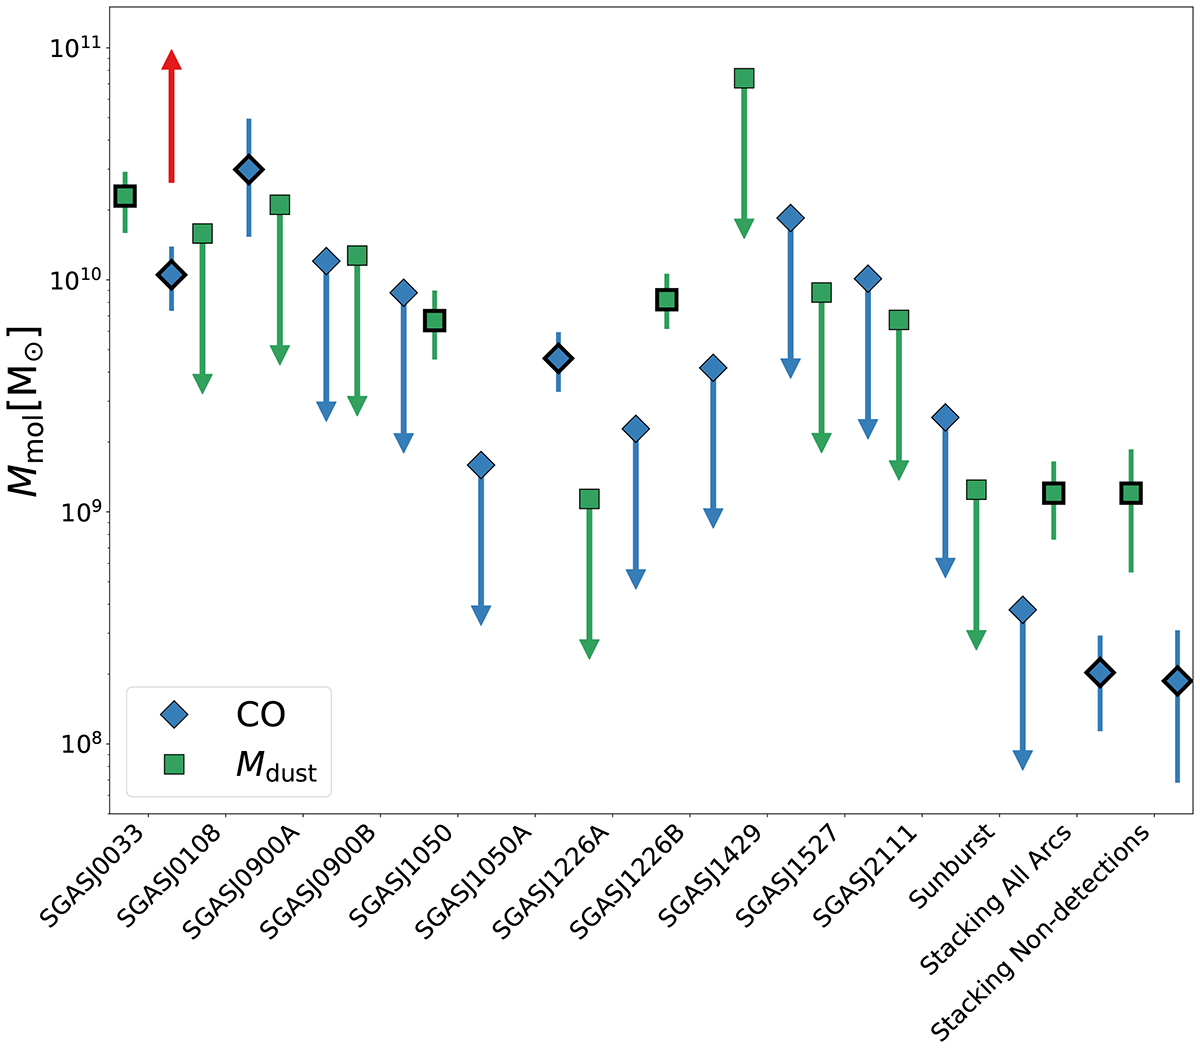
Fig. 9.
Download original image
Comparison of the molecular gas mass estimates using the two methods discussed in the text. The red arrow shows by how much the CO points would be displaced if we had used the Accurso et al. (2017) model for αCO. The stacking samples were created using weighted averages with weights of 1/σ2. The stacking All Arcs considers all arcs while stacking non-detections only considers arcs without detection. Markers with a black edge and error bars indicate detections.
Current usage metrics show cumulative count of Article Views (full-text article views including HTML views, PDF and ePub downloads, according to the available data) and Abstracts Views on Vision4Press platform.
Data correspond to usage on the plateform after 2015. The current usage metrics is available 48-96 hours after online publication and is updated daily on week days.
Initial download of the metrics may take a while.