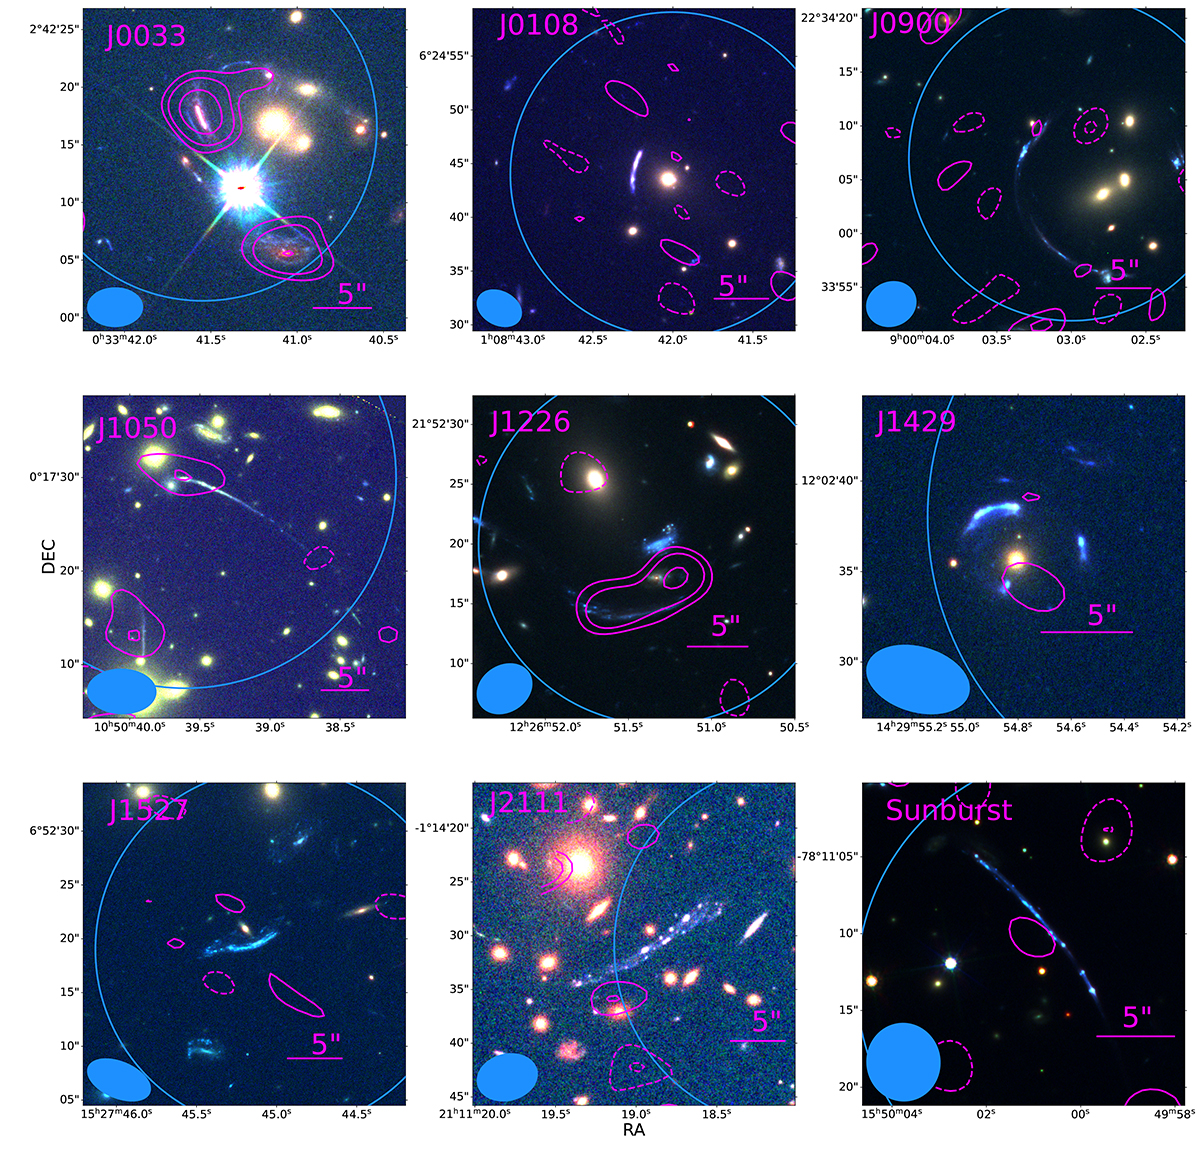
Fig. 4.
Download original image
HST color images of gravitational arc systems with overlaid contours showing dust continuum emission observed with ACA at different σ levels (−5, −3, −2, 2, 3, 5). Dashed lines correspond to negative values while solid lines are positive values. The sizes of the synthesized beams are indicated in the bottom left corners of the images. Additionally, the large circles represent the ACA’s primary beam at a value of 0.5 for the respective target fields.
Current usage metrics show cumulative count of Article Views (full-text article views including HTML views, PDF and ePub downloads, according to the available data) and Abstracts Views on Vision4Press platform.
Data correspond to usage on the plateform after 2015. The current usage metrics is available 48-96 hours after online publication and is updated daily on week days.
Initial download of the metrics may take a while.