Fig. 3.
Download original image
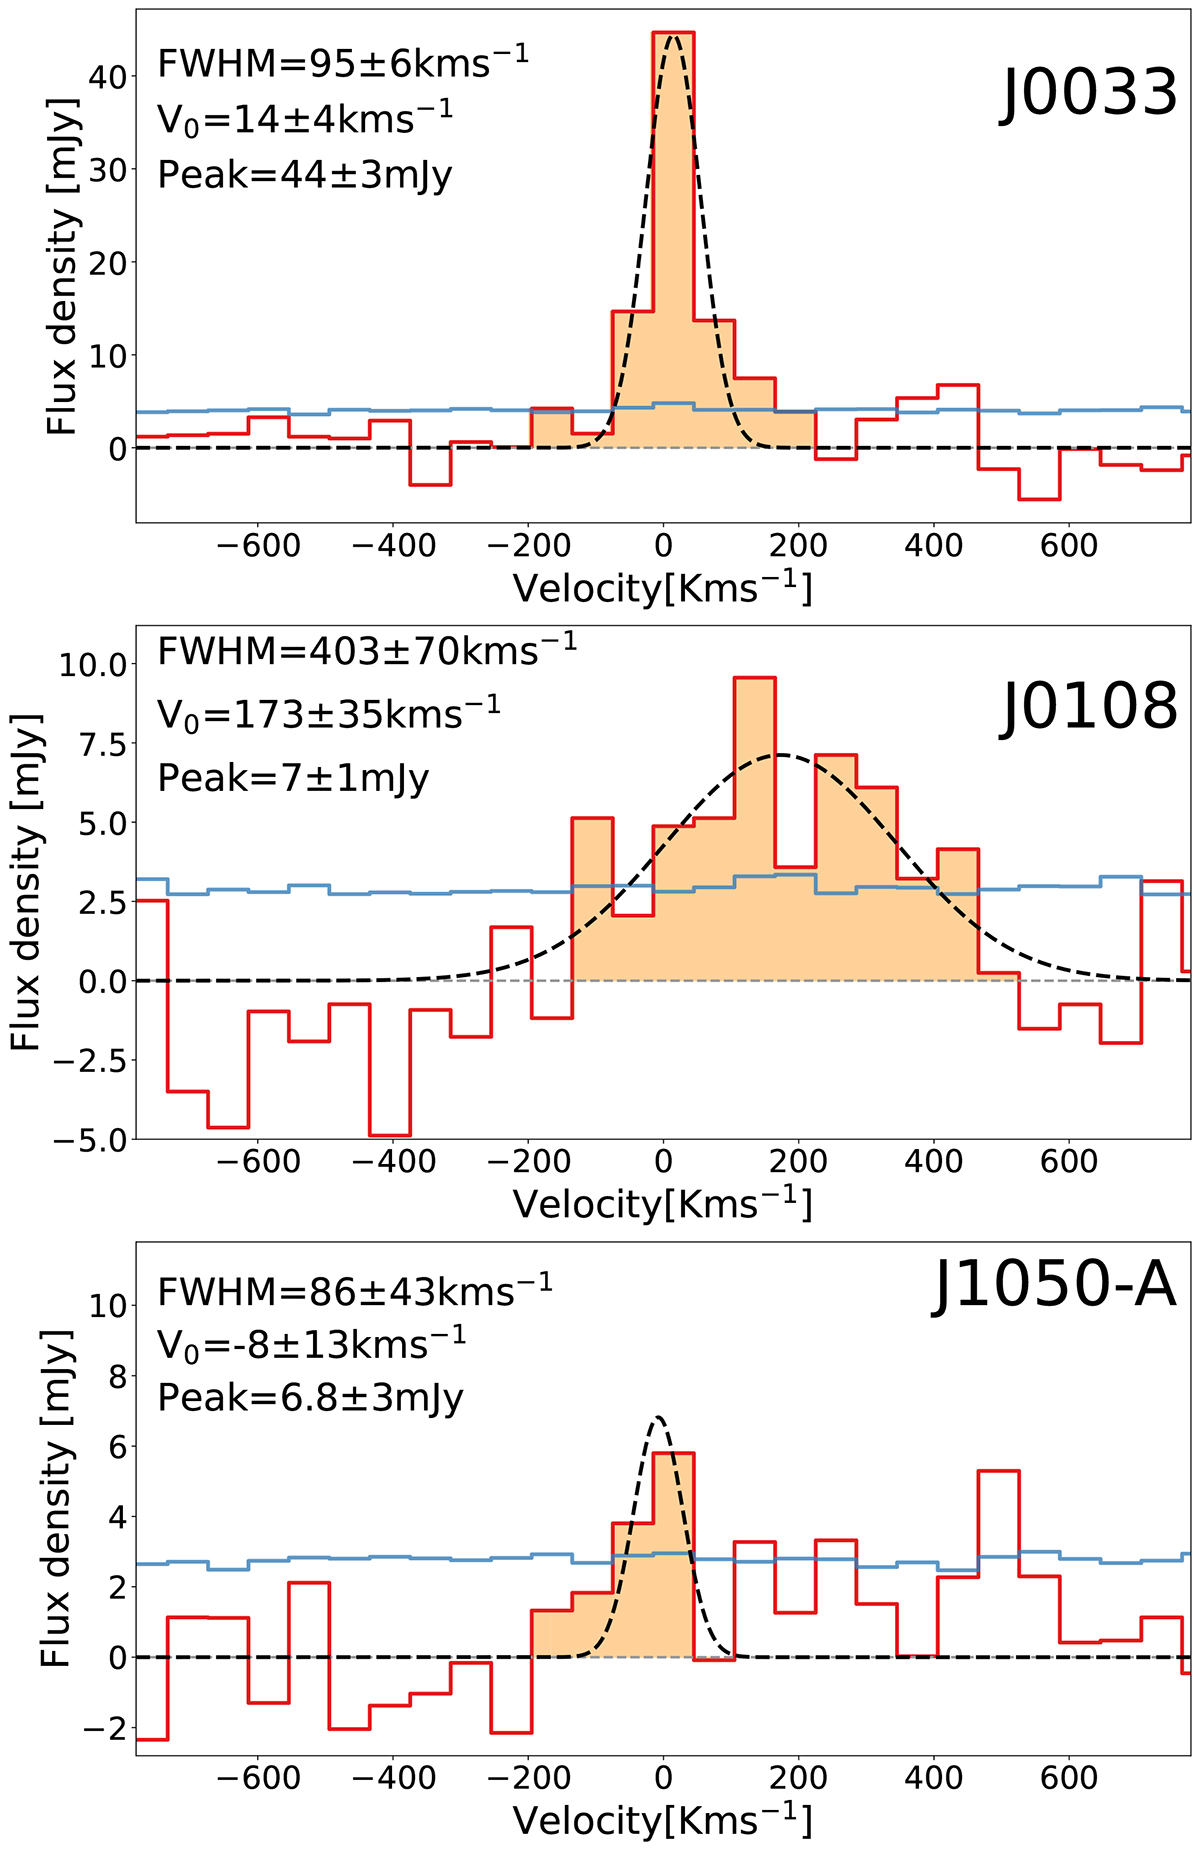
Spectra of the CO emission detections. The galaxies shown are J0033 (top), J0108 (middle), and J1050A (bottom). All plots are centered to an optical velocity of zero. The orange channels correspond to the channels collapsed to create the zeroth moment. A Gaussian fit (black curve) is overlaid to determine the fit parameters, the full width half maximum (FWHM) in km s−1, the maximum amplitude in mJy, and the velocity in which the Gaussian is centered. The blue lines represent the 1σ noise level.
Current usage metrics show cumulative count of Article Views (full-text article views including HTML views, PDF and ePub downloads, according to the available data) and Abstracts Views on Vision4Press platform.
Data correspond to usage on the plateform after 2015. The current usage metrics is available 48-96 hours after online publication and is updated daily on week days.
Initial download of the metrics may take a while.