Open Access
Fig. A.1.
Download original image
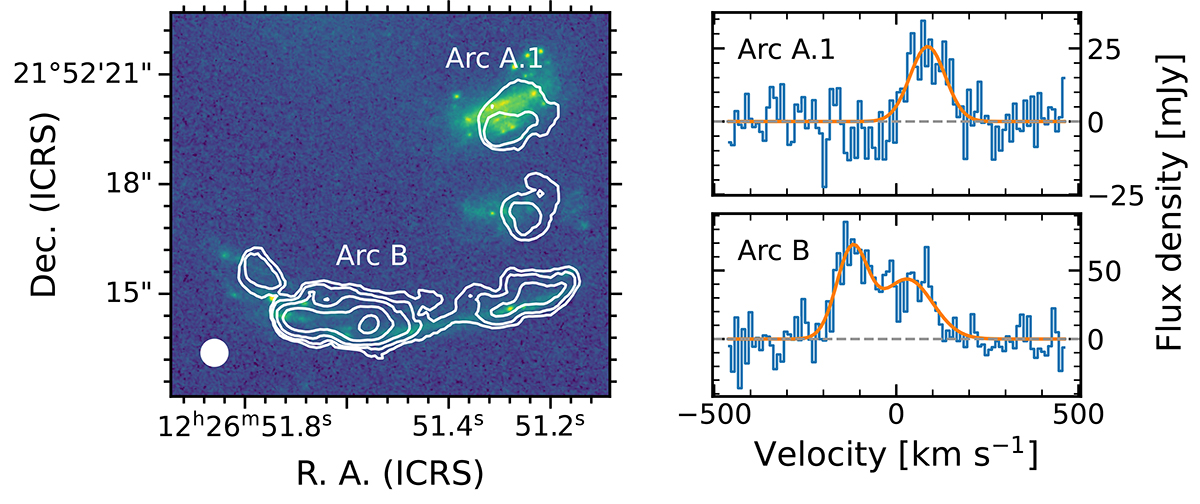
HST ACS/F606W image of the J1226 field with ALMA [CII] contours (white). The first contour is at the surface brightness level of 0.21 Jy km s−1 beam−1, corresponding to S/N∼3. Subsequent levels increase as powers of ![]() . Inset axes show the integrated spectra of J1226-A.1 (top) and J1226-B (bottom).
. Inset axes show the integrated spectra of J1226-A.1 (top) and J1226-B (bottom).
Current usage metrics show cumulative count of Article Views (full-text article views including HTML views, PDF and ePub downloads, according to the available data) and Abstracts Views on Vision4Press platform.
Data correspond to usage on the plateform after 2015. The current usage metrics is available 48-96 hours after online publication and is updated daily on week days.
Initial download of the metrics may take a while.