Open Access
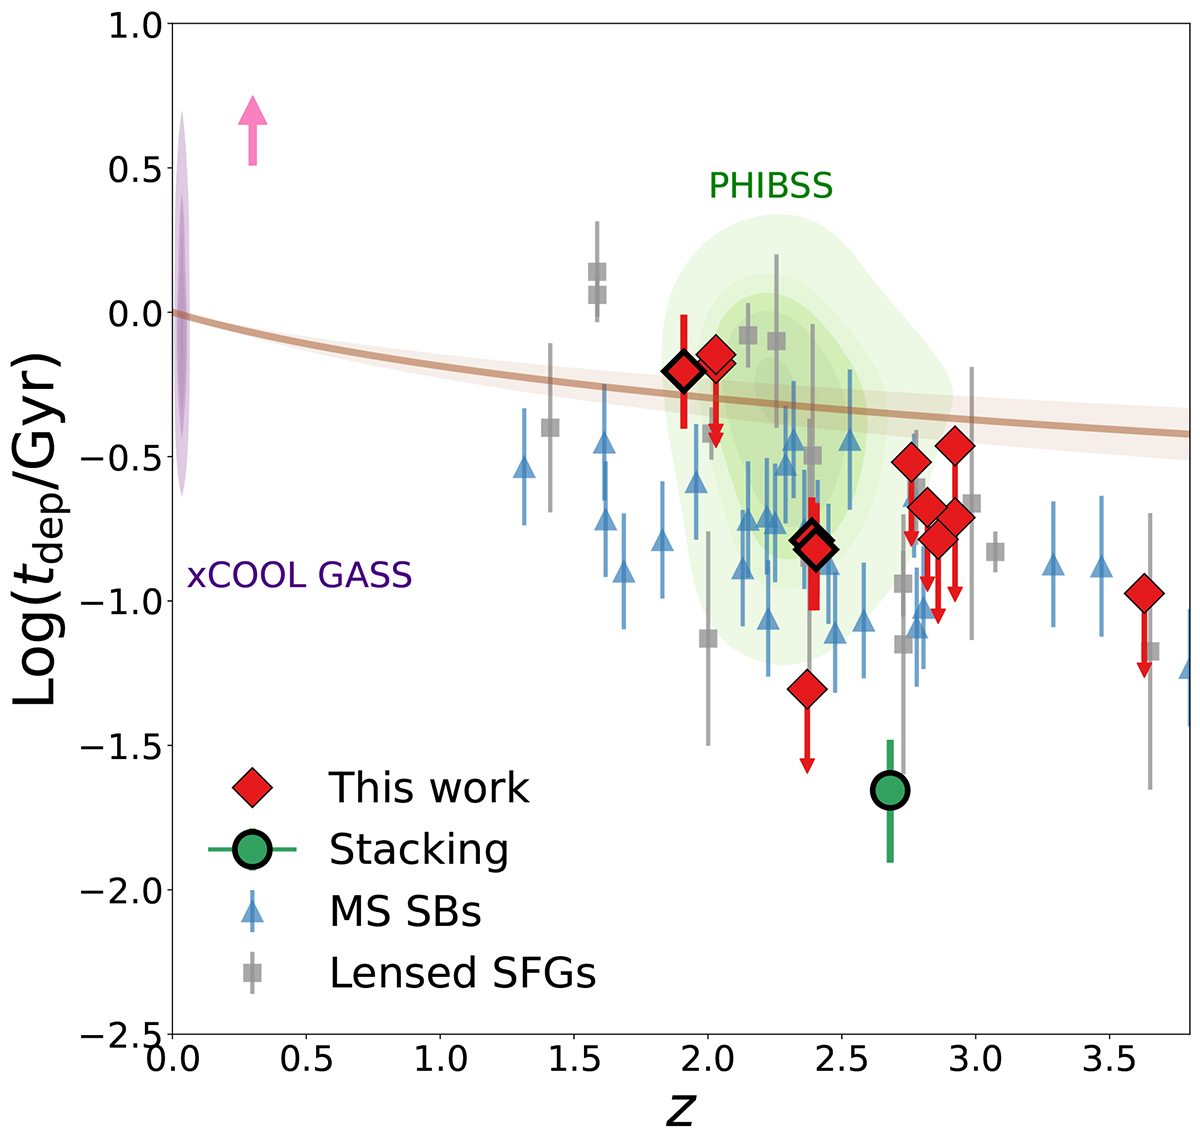
Fig. 12.
Download original image
Same as Fig. 10 but for depletion time as a function of redshift. The brown line represents the scaling relation established by Tacconi et al. (2018). The pink arrow corresponds to how much the CO points would move upwards if we were to use the Accurso et al. (2017) model for αCO.
Current usage metrics show cumulative count of Article Views (full-text article views including HTML views, PDF and ePub downloads, according to the available data) and Abstracts Views on Vision4Press platform.
Data correspond to usage on the plateform after 2015. The current usage metrics is available 48-96 hours after online publication and is updated daily on week days.
Initial download of the metrics may take a while.