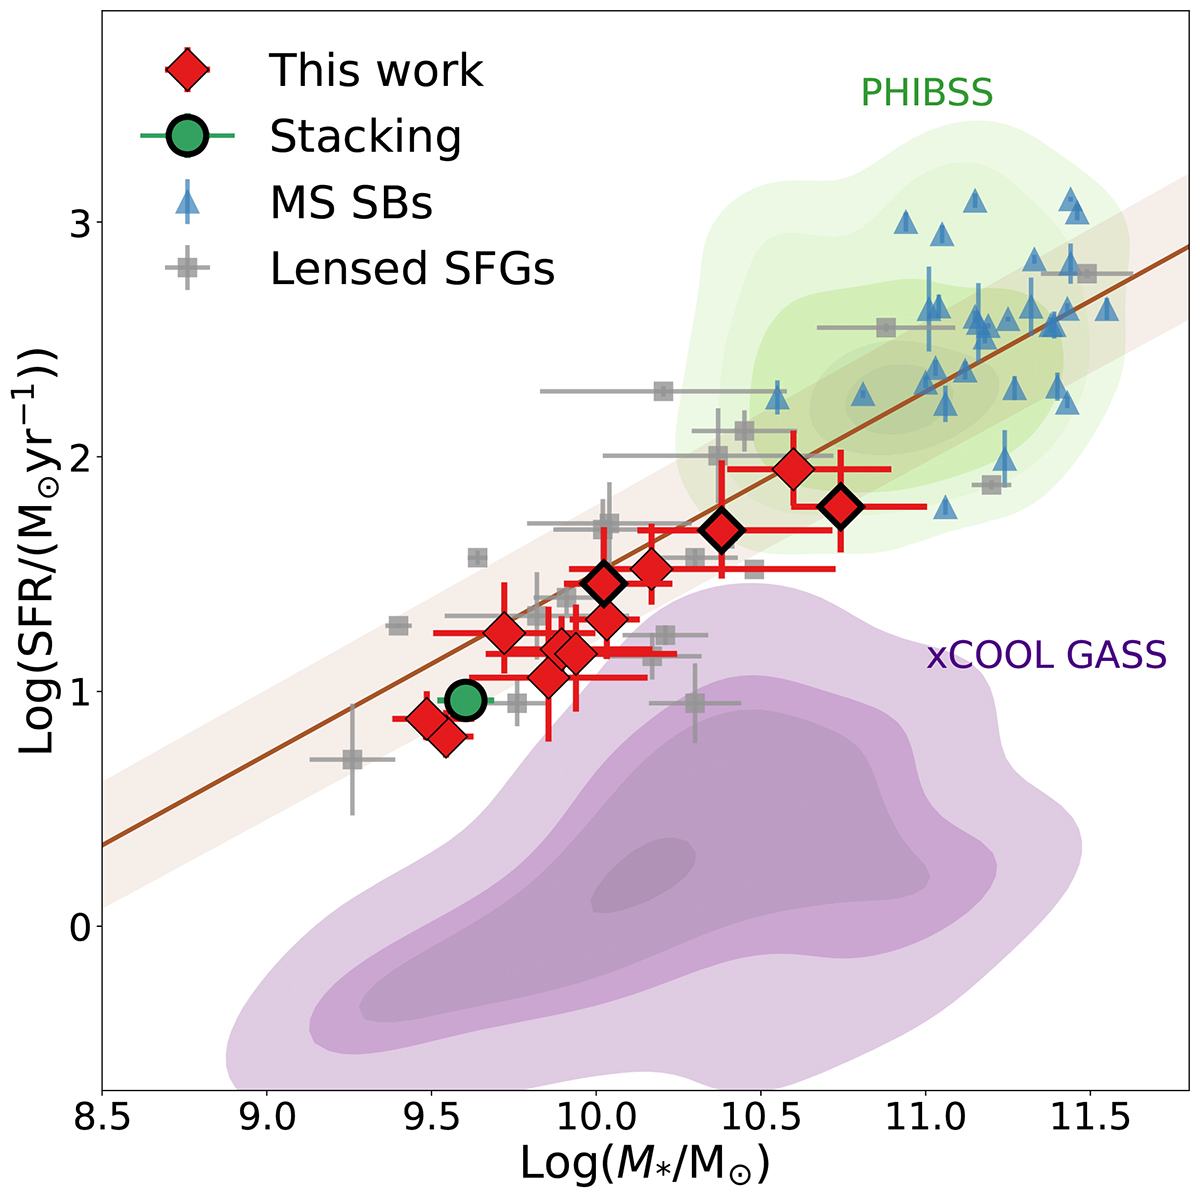
Fig. 10.
Download original image
SFR as a function of stellar mass, known as the galaxy MS. The brown line denotes the MS at redshift 2.5 established by Speagle et al. (2014). Gray markers represent lensed SFGs (Saintonge et al. 2013; Dessauges-Zavadsky et al. 2015; Motta et al. 2018; Tsujita et al. 2024), while blue markers are MS SBs from Gómez-Guijarro et al. (2022). The purple contours are density plots of the xCOOL GASS data, while the green contours are the PHIBSS data from Tacconi et al. (2018). Red markers indicate the galaxies from this work; they represent detections when they have a black edge and error bars. The stacking value corresponds to the All Arcs value.
Current usage metrics show cumulative count of Article Views (full-text article views including HTML views, PDF and ePub downloads, according to the available data) and Abstracts Views on Vision4Press platform.
Data correspond to usage on the plateform after 2015. The current usage metrics is available 48-96 hours after online publication and is updated daily on week days.
Initial download of the metrics may take a while.