Fig. 8.
Download original image
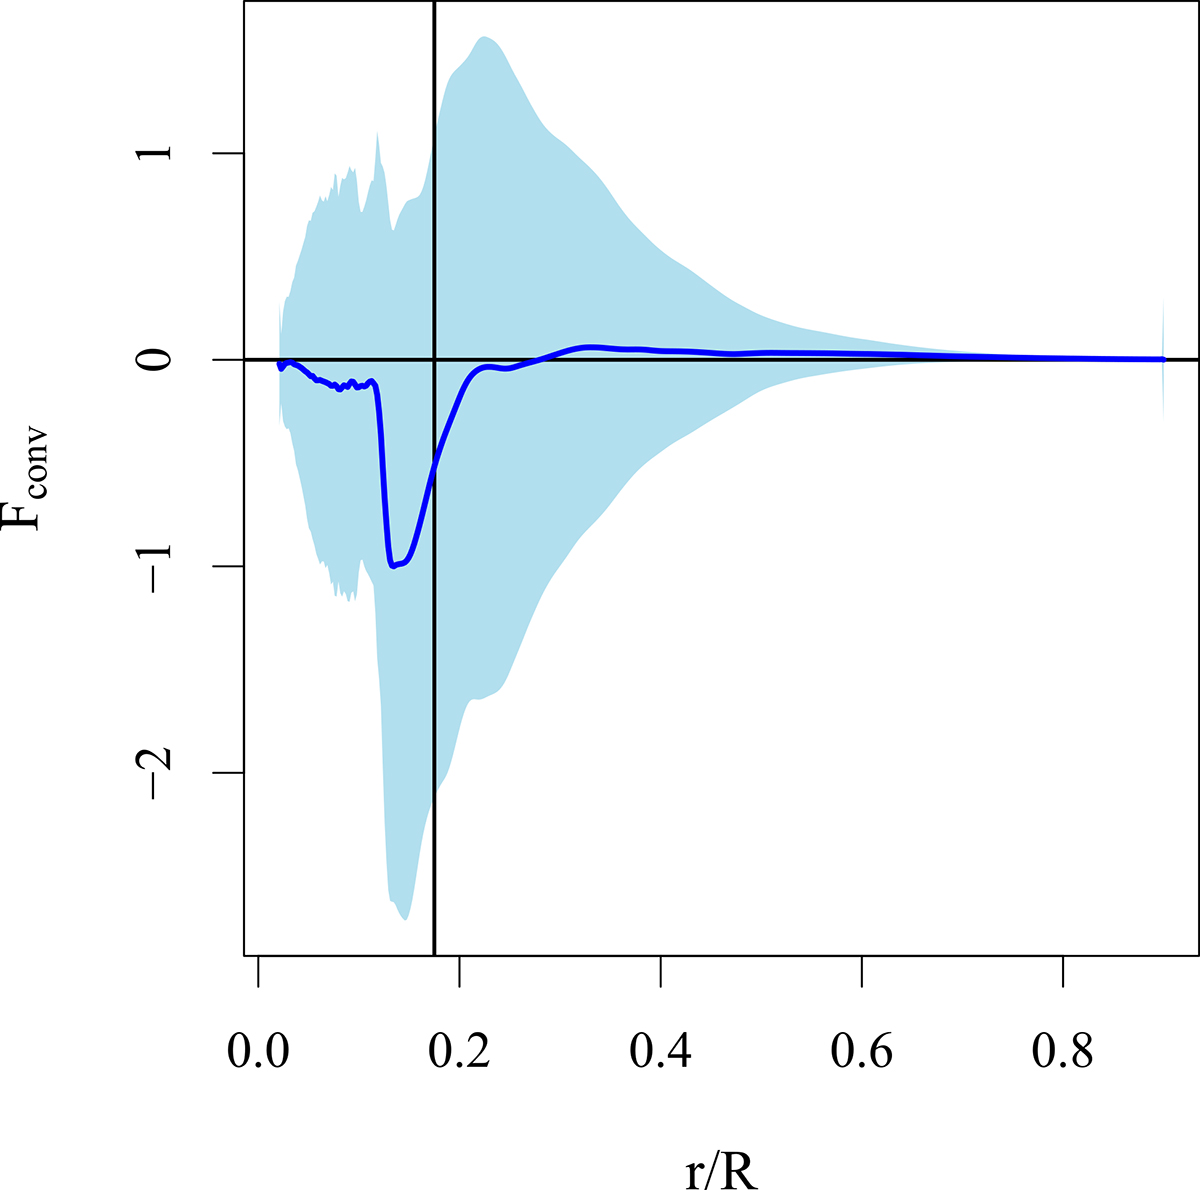
Radial profile of time-averaged convective flux, normalized to its maximum magnitude value, for the 3 M⊙ red giant simulation bg2D. The shaded region represents one standard deviation in time above and below the time-averaged line. The radial position of the convective boundary determined by the Schwarzschild criterion is indicated by a vertical black line.
Current usage metrics show cumulative count of Article Views (full-text article views including HTML views, PDF and ePub downloads, according to the available data) and Abstracts Views on Vision4Press platform.
Data correspond to usage on the plateform after 2015. The current usage metrics is available 48-96 hours after online publication and is updated daily on week days.
Initial download of the metrics may take a while.