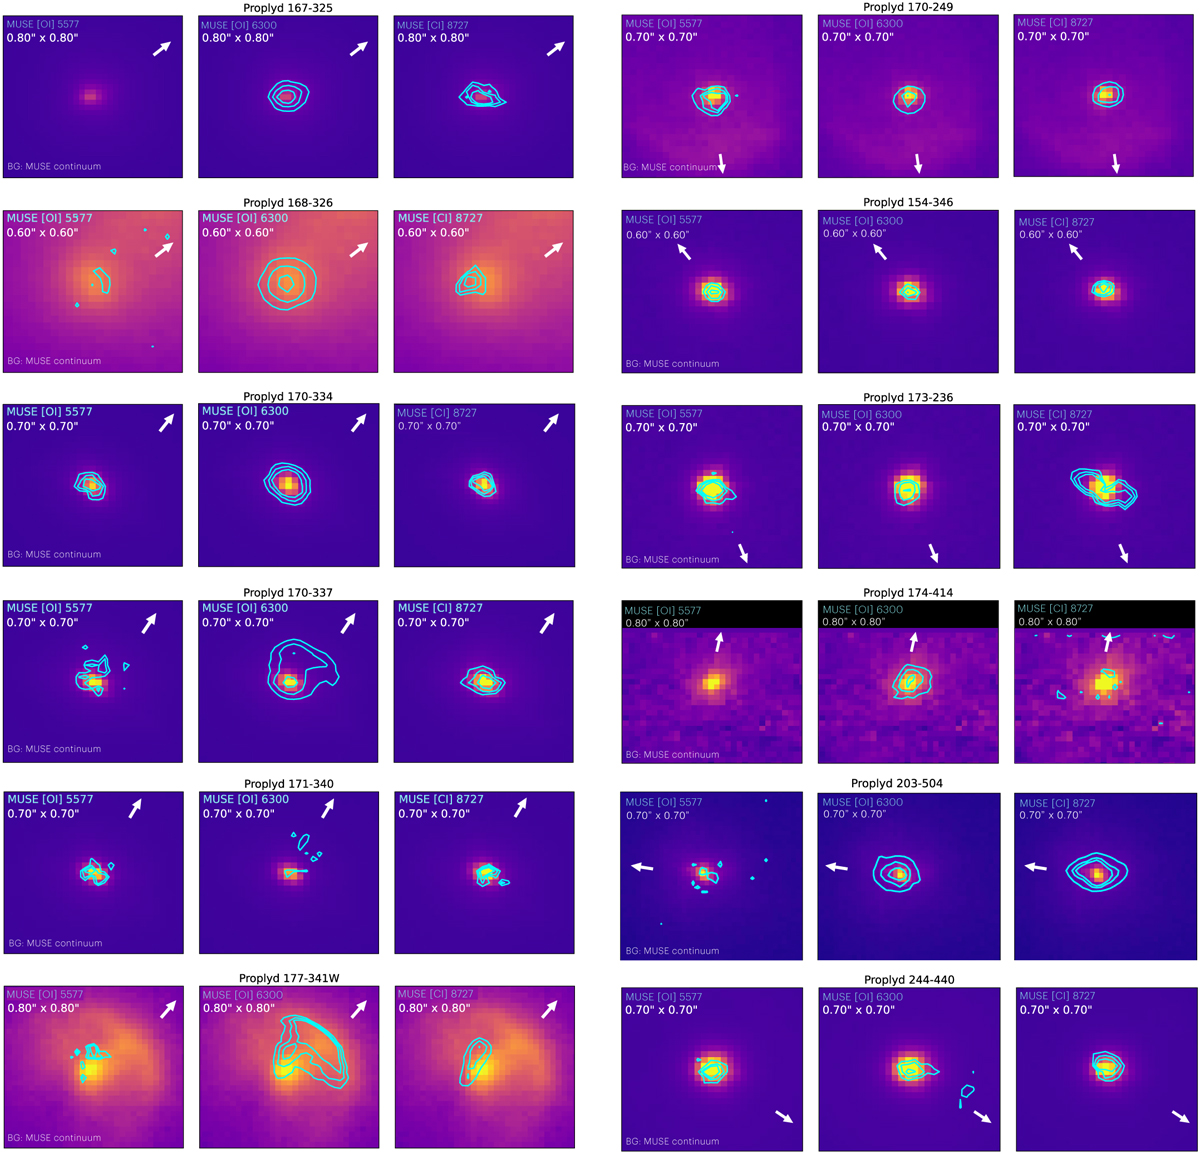
Fig. 2
Download original image
Spatial comparison between MUSE stellar continuum (colormap) and MUSE emission lines (contours) for proplyds 154–346, 167–325, 168–326, 170–249, 170–334, 170–337, 171–340, 173–236, 174–414, 177–341W, 203–504, and 244–440. The emission line and the size of each image are shown in the top left corner. The contours represent 50%, 70%, and 90% of the peak intensity of the MUSE emission lines, except for the [C I] line of 174–414 for which only 90% is shown. The direction of the UV source is shown with an arrow.
Current usage metrics show cumulative count of Article Views (full-text article views including HTML views, PDF and ePub downloads, according to the available data) and Abstracts Views on Vision4Press platform.
Data correspond to usage on the plateform after 2015. The current usage metrics is available 48-96 hours after online publication and is updated daily on week days.
Initial download of the metrics may take a while.