Fig. 1
Download original image
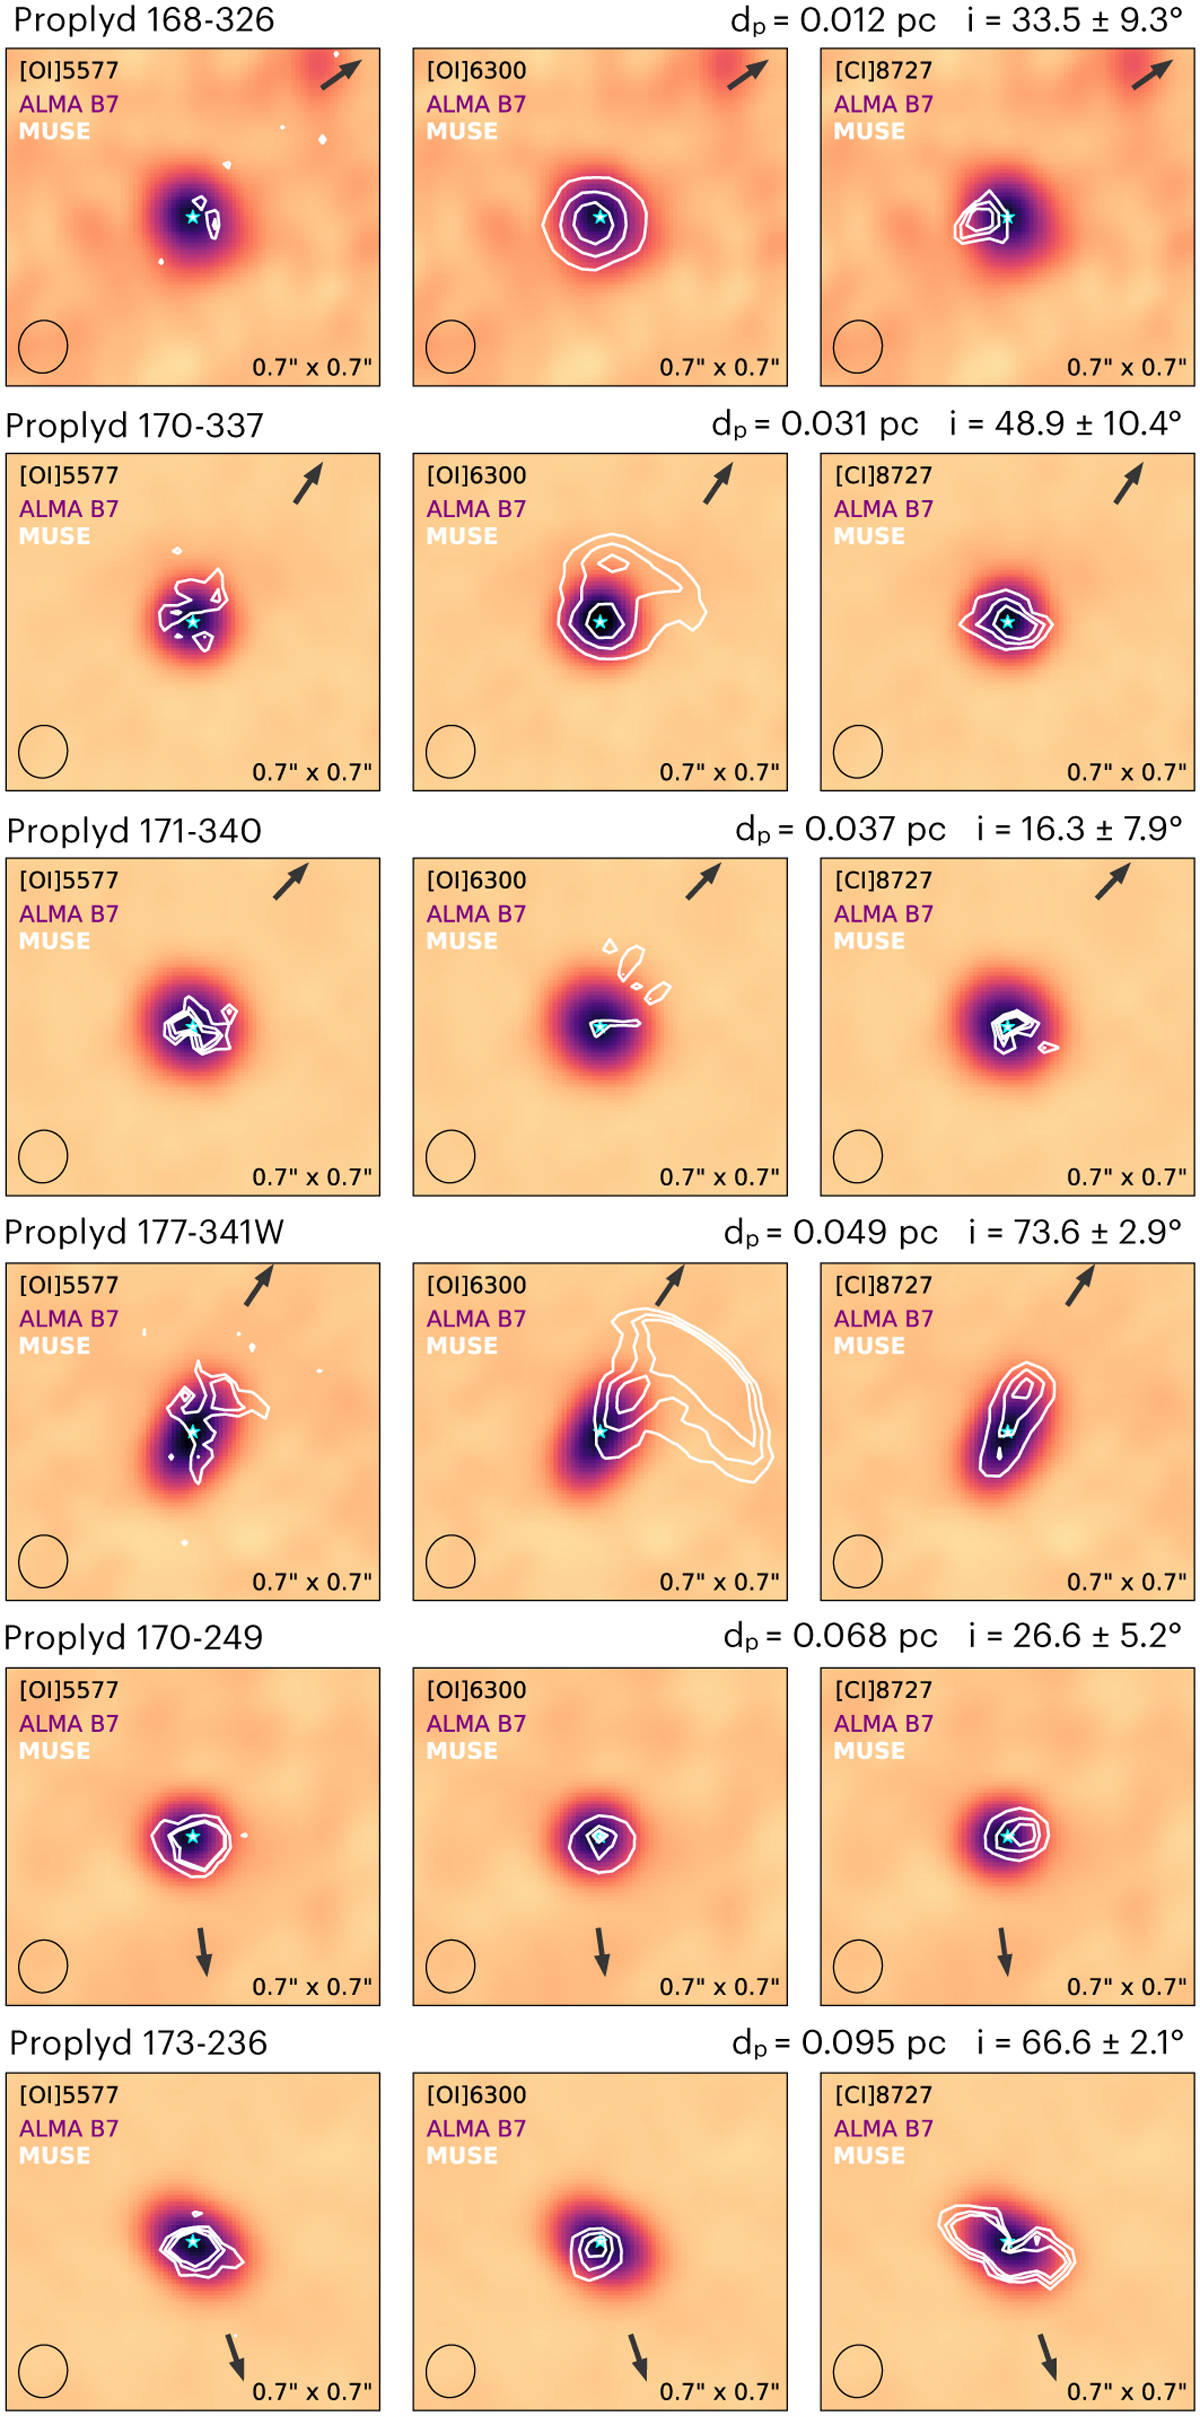
ALMA Band 7 images of proplyds 168–326, 170–337, 171–340, 177–341W, 170–249, and 173–236 compared with the MUSE emission lines (contours) at 50%, 70%, and 90% of the peak intensity; the rows are ordered in increasing projected distance from θ1 Ori C. The ALMA Band 7 data were originally published by Eisner et al. (2018); the values for inclination marked above the figures are from Ballering et al. (2023), except for 168–326 and 171–340 (Ballering et al., in prep.). The MUSE emission lines are shown in the top left corner, the beam size is indicated in the bottom left corner, and the size of each image in the bottom right corner. The direction of the UV source is shown with an arrow. The cyan star marks the star’s estimated location.
Current usage metrics show cumulative count of Article Views (full-text article views including HTML views, PDF and ePub downloads, according to the available data) and Abstracts Views on Vision4Press platform.
Data correspond to usage on the plateform after 2015. The current usage metrics is available 48-96 hours after online publication and is updated daily on week days.
Initial download of the metrics may take a while.