Open Access
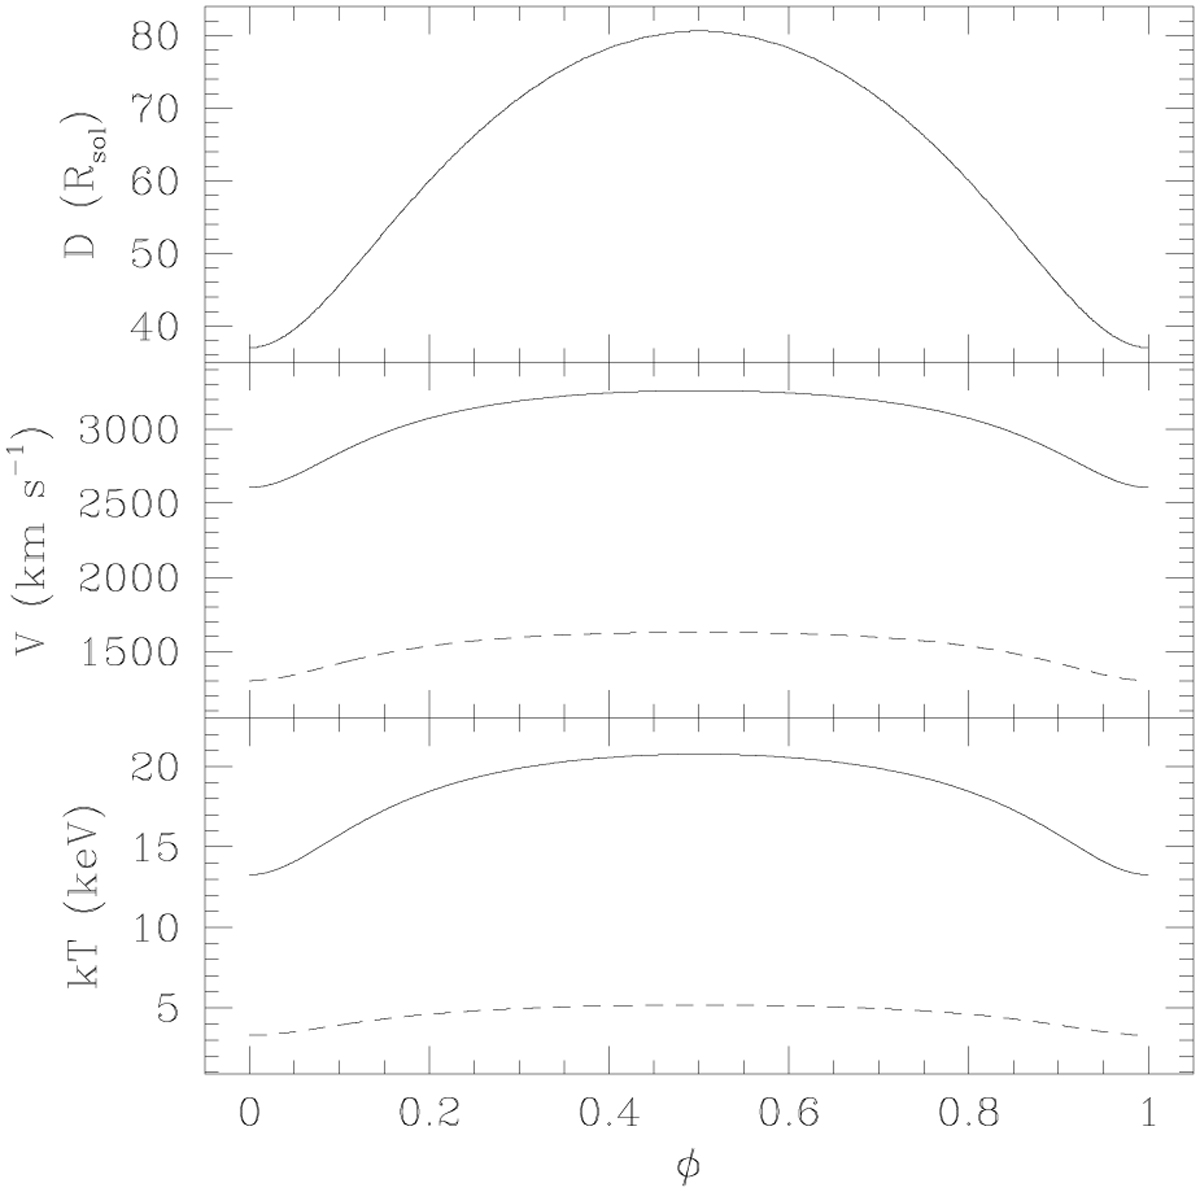
Fig. 9
Download original image
Plot of the stellar separation (upper panel), the pre-shock velocity (middle panel), and the post-shock temperature (lower panel) as a function of the orbital phase. Solid lines stand for a first approximation of the pre-shock velocity while dashed lines illustrate the case of strong radiative inhibition.
Current usage metrics show cumulative count of Article Views (full-text article views including HTML views, PDF and ePub downloads, according to the available data) and Abstracts Views on Vision4Press platform.
Data correspond to usage on the plateform after 2015. The current usage metrics is available 48-96 hours after online publication and is updated daily on week days.
Initial download of the metrics may take a while.