Open Access
Fig. A.1
Download original image
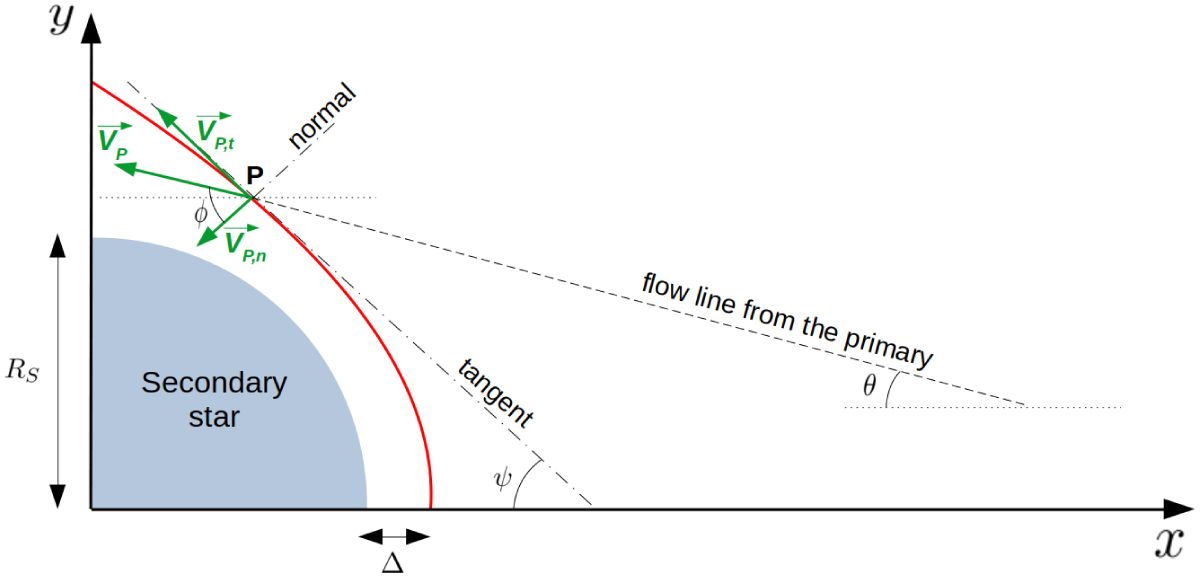
Illustration of the shock shape (red curve) produced by the WPC at an arbitrary orbital phase. Details required to compute the normal component of the pre-shock velocity are shown. The line of centers of the system is along the x-axis.
Current usage metrics show cumulative count of Article Views (full-text article views including HTML views, PDF and ePub downloads, according to the available data) and Abstracts Views on Vision4Press platform.
Data correspond to usage on the plateform after 2015. The current usage metrics is available 48-96 hours after online publication and is updated daily on week days.
Initial download of the metrics may take a while.