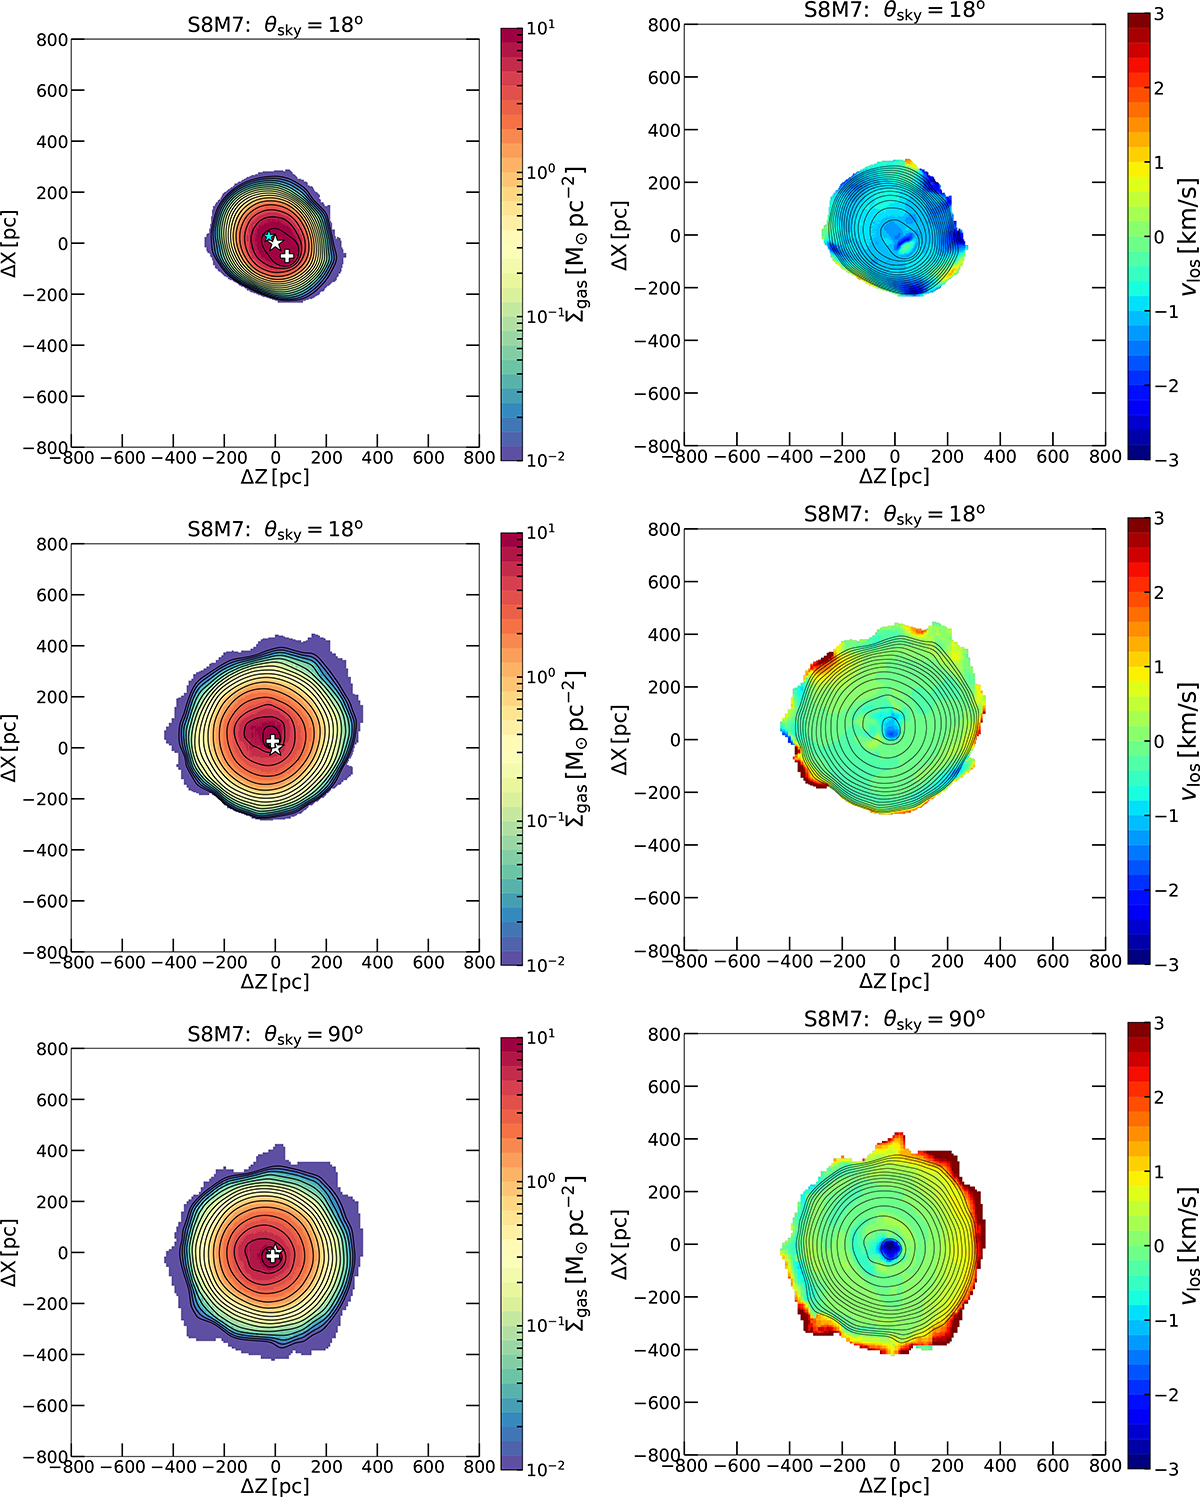
Fig. 9.
Download original image
Scenario III: Snapshots of the gas surface mass density map of the model M19 (S8M7) taken at two different times; at 173 Myr (top row) and at 277 Myr (middle and bottom row) after the initial gas offset. This model uses the dwarf model D2t, similar to model D2, but with two gas components. This uses a first infall orbital solution with a final tangential velocity of ![]() , corresponding to a projection angle of θsky = 18° (top and middle rows). We also include a projection of 90° to analyse the kinematic features of this solution (bottom row). The combined centre of mass of the stellar and dark matter components is marked with a white star, while the gas surface density peak is marked with a white cross. The vlos maps are in the rest frame of the dwarf’s dark matter centre of mass. We note that
, corresponding to a projection angle of θsky = 18° (top and middle rows). We also include a projection of 90° to analyse the kinematic features of this solution (bottom row). The combined centre of mass of the stellar and dark matter components is marked with a white star, while the gas surface density peak is marked with a white cross. The vlos maps are in the rest frame of the dwarf’s dark matter centre of mass. We note that ![]() corresponds here to NHI = 1.2 × 1020 cm−2.
corresponds here to NHI = 1.2 × 1020 cm−2.
Current usage metrics show cumulative count of Article Views (full-text article views including HTML views, PDF and ePub downloads, according to the available data) and Abstracts Views on Vision4Press platform.
Data correspond to usage on the plateform after 2015. The current usage metrics is available 48-96 hours after online publication and is updated daily on week days.
Initial download of the metrics may take a while.