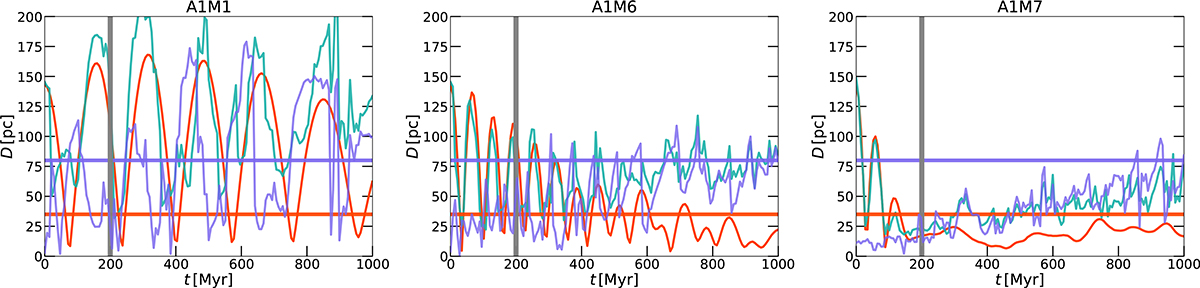
Fig. 6.
Download original image
Scenario II: Temporal evolution of model M8 (A1M1) (left), which uses the dwarf model D1; model M9 (A1M6) using D2 (middle); and model M12 (A1M7) using D4 (right). We show the distances with respect to the centre of mass of the dark matter halo of the younger stellar component (red curve), and to the peak of the gas surface mass density (blue) measured with θsky = 0deg to quantify the maximum distances it could reach. We also show the distance between the younger stellar component centre and the gas surface density peak (turquoise). The observed 80 pc offset between the gas density peak and the stellar component in Leo T is indicated with a blue horizontal line (AO18). The 35 pc offset between the younger and older stellar components is shown with the red horizontal line, while the vertical line indicates the lower age estimate of the younger stellar component (de Jong et al. 2008).
Current usage metrics show cumulative count of Article Views (full-text article views including HTML views, PDF and ePub downloads, according to the available data) and Abstracts Views on Vision4Press platform.
Data correspond to usage on the plateform after 2015. The current usage metrics is available 48-96 hours after online publication and is updated daily on week days.
Initial download of the metrics may take a while.