Fig. 5.
Download original image
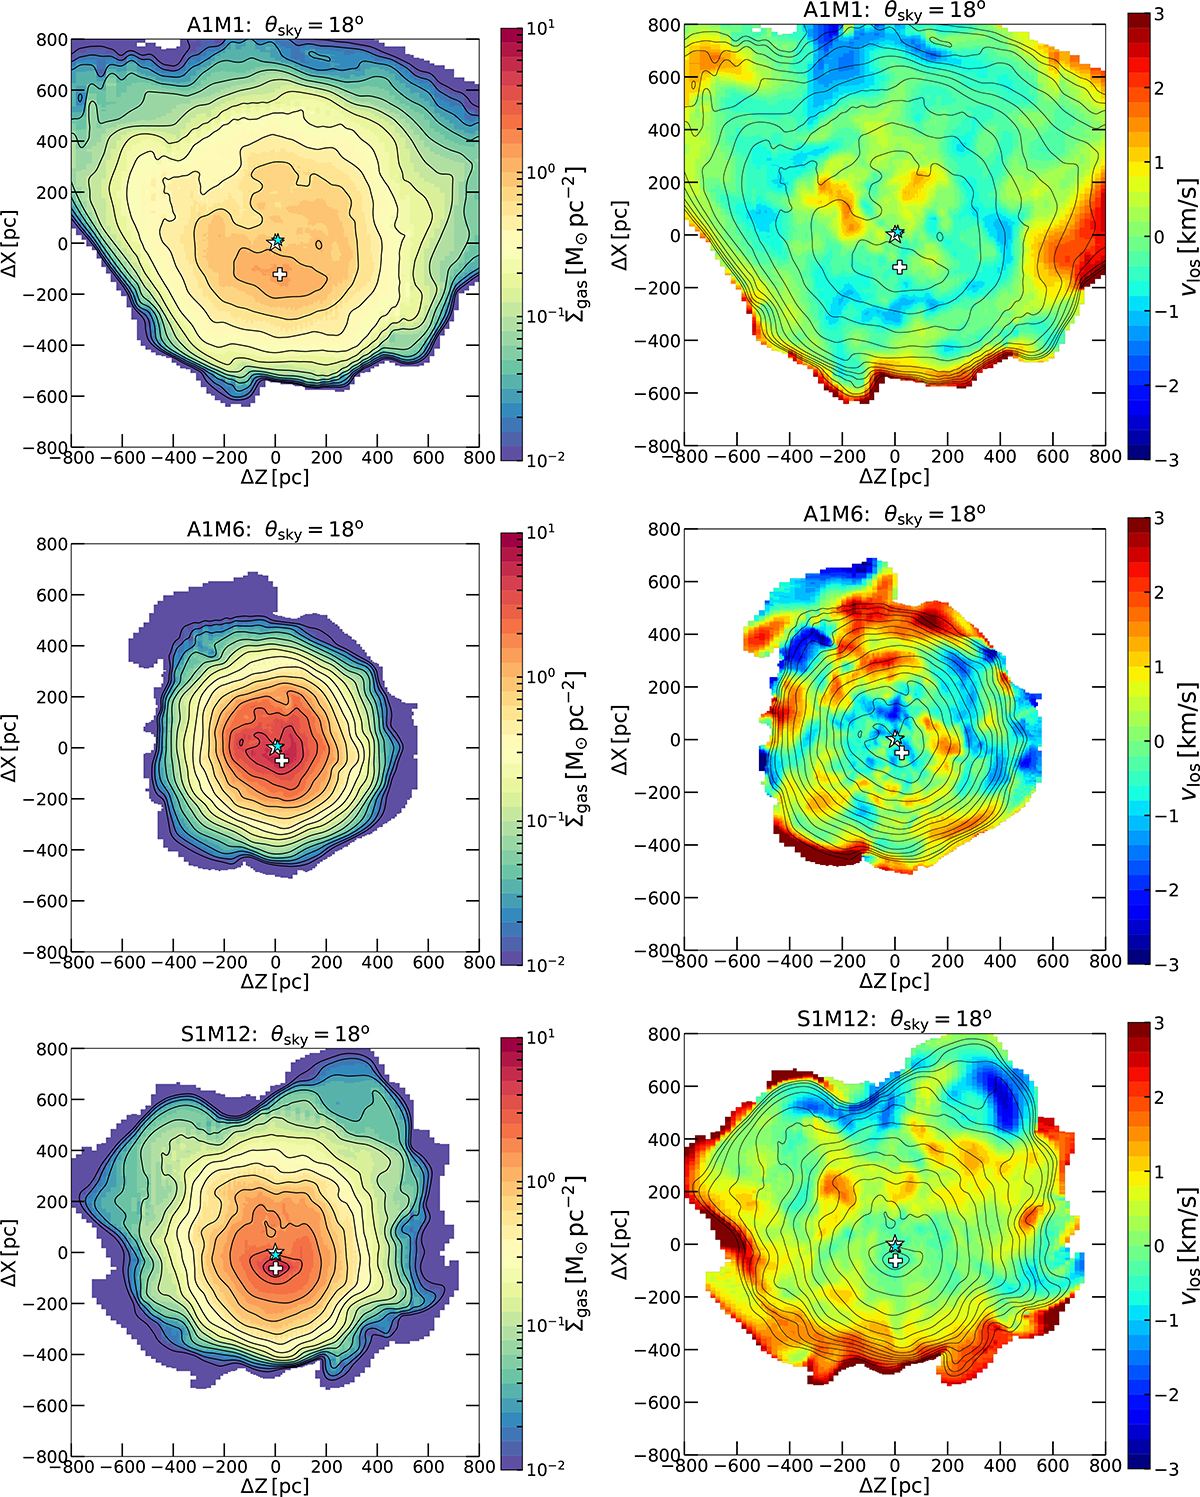
Scenario II: Snapshots of model M8 (A1M1) at 957 Myr with the dwarf model D1 (top row), model M9 (A1M6) at 358 Myr with D2 (middle row), and model M10 (S1M12) at 407 Myr with D1t that has two gas components (bottom row). Surface mass density maps (left column) and the LOS velocity maps (right column) and contours are calculated with gas colder than T < 104 K. The orbit corresponds to a first infall solution (FI) with a final tangential velocity of ![]() that corresponds to a projection angle of θsky = 18°. The centre of mass of the old stellar and dark matter components is marked with a white star, while the younger stellar component centre of mass is marked with a cyan star, and the gas peak with a white cross. The snapshots were selected to qualitatively match the HI morphology of Leo T, showing the central gas isocontours displaced from the centre of mass of the dwarf, and with the younger component slightly offset as well. We note that the vlos maps are in the rest frame of the dwarf’s dark matter centre of mass. We note that
that corresponds to a projection angle of θsky = 18°. The centre of mass of the old stellar and dark matter components is marked with a white star, while the younger stellar component centre of mass is marked with a cyan star, and the gas peak with a white cross. The snapshots were selected to qualitatively match the HI morphology of Leo T, showing the central gas isocontours displaced from the centre of mass of the dwarf, and with the younger component slightly offset as well. We note that the vlos maps are in the rest frame of the dwarf’s dark matter centre of mass. We note that ![]() corresponds here to NHI = 1.2 × 1020 cm−2.
corresponds here to NHI = 1.2 × 1020 cm−2.
Current usage metrics show cumulative count of Article Views (full-text article views including HTML views, PDF and ePub downloads, according to the available data) and Abstracts Views on Vision4Press platform.
Data correspond to usage on the plateform after 2015. The current usage metrics is available 48-96 hours after online publication and is updated daily on week days.
Initial download of the metrics may take a while.