Fig. 3.
Download original image
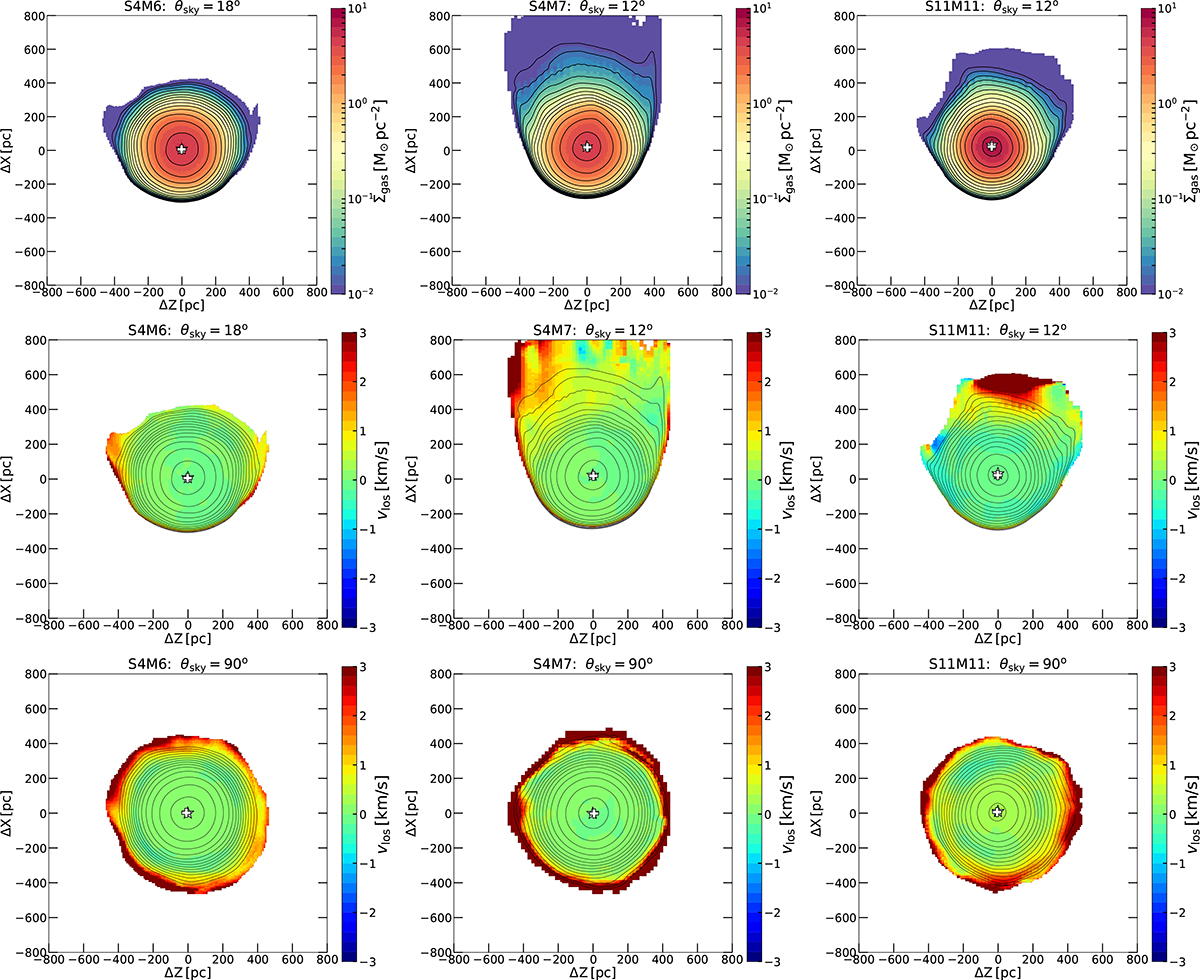
Scenario I: Final snapshots of three models evolved from −2 Gyr until the current position of Leo T. We show two models that used the fiducial dwarf model D1, model M3 (S4M6) (left column) with a final tangential velocity of ![]() and model M4 (S4M7) (middle column) with
and model M4 (S4M7) (middle column) with ![]() . We also show model M7 (S11M11) (right column), which uses the more massive dwarf model D2 and
. We also show model M7 (S11M11) (right column), which uses the more massive dwarf model D2 and ![]() . The first and second rows show the surface mass and line-of-sight (LOS) velocity maps projected according to attack angles θsky expected from the orbital orientation (Eq. (1)). We note that vlos are in the dark matter centre of mass rest frame. In the bottom row we include images with a projection of θsky = 90° to reveal the morphology and the maximum velocity gradients along the orbits. The centre of mass of the combined stellar and dark matter distributions is marked with white stars, and the gas peaks are marked with white crosses. To better represent the HI observations we made the calculations with gas colder than T < 104 K. The vlos maps are in the rest frame of the dwarf’s dark matter centre of mass, and the centre of mass of the stellar and dark matter components overlap in all panels. The contours on the leading side may cover the velocity map due to the strong compression; this can be avoided by zooming in the pdf version. We note that
. The first and second rows show the surface mass and line-of-sight (LOS) velocity maps projected according to attack angles θsky expected from the orbital orientation (Eq. (1)). We note that vlos are in the dark matter centre of mass rest frame. In the bottom row we include images with a projection of θsky = 90° to reveal the morphology and the maximum velocity gradients along the orbits. The centre of mass of the combined stellar and dark matter distributions is marked with white stars, and the gas peaks are marked with white crosses. To better represent the HI observations we made the calculations with gas colder than T < 104 K. The vlos maps are in the rest frame of the dwarf’s dark matter centre of mass, and the centre of mass of the stellar and dark matter components overlap in all panels. The contours on the leading side may cover the velocity map due to the strong compression; this can be avoided by zooming in the pdf version. We note that ![]() corresponds here to NHI = 1.2 × 1020 cm−2, and the spacing between contours is
corresponds here to NHI = 1.2 × 1020 cm−2, and the spacing between contours is ![]() for all simulation figures.
for all simulation figures.
Current usage metrics show cumulative count of Article Views (full-text article views including HTML views, PDF and ePub downloads, according to the available data) and Abstracts Views on Vision4Press platform.
Data correspond to usage on the plateform after 2015. The current usage metrics is available 48-96 hours after online publication and is updated daily on week days.
Initial download of the metrics may take a while.