Fig. 2.
Download original image
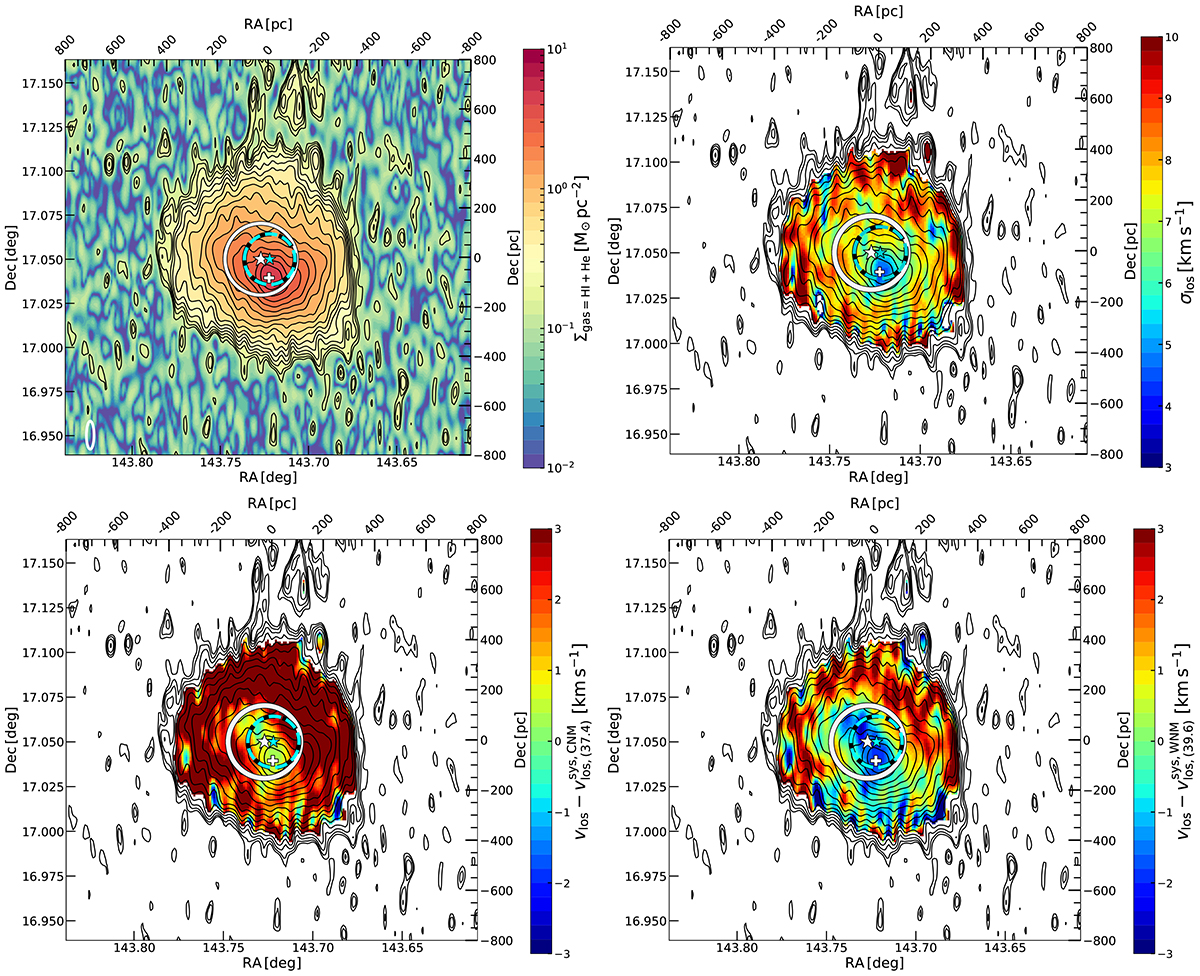
HI observations from AO18 taken with the Westerbork Synthesis Radio Telescope (WSRT), showing the HI gas surface mass density map (top left), the HI line-of-sight velocity dispersion map (top right), the HI line-of-sight velocity map where the heliocentric systemic CNM velocity is subtracted (37.4 km s−1 (bottom left), and the HI line-of-sight heliocentric velocity map where the heliocentric systemic WNM velocity is subtracted (39.6 km s−1) (bottom right). The stellar heliocentric systemic velocity lies between the two gas velocity estimates, with 38 ± 2 km s−1. All panels show the HI iso-contours separated by 0.1 dex, the HI peak marked with a white cross. The old and younger stellar population positions and their respective (projected) half-light radii of 1.22′ (145 pc),0.86′ (102 pc) are marked with stars and circles coloured in white (old stars) and cyan (younger stars), according to de Jong et al. (2008). AO18 fitted an ellipse to the external HI contours (R ∼ 400 pc), finding its centre near the old stellar component position. Here ![]() corresponds to NHI = 1.2 × 1020 cm−2. The WSRT beam size of (15.7 × 57.3) arcsec = (31, 113) pc is displayed with the white ellipse in the lower left corner of the top left panel.
corresponds to NHI = 1.2 × 1020 cm−2. The WSRT beam size of (15.7 × 57.3) arcsec = (31, 113) pc is displayed with the white ellipse in the lower left corner of the top left panel.
Current usage metrics show cumulative count of Article Views (full-text article views including HTML views, PDF and ePub downloads, according to the available data) and Abstracts Views on Vision4Press platform.
Data correspond to usage on the plateform after 2015. The current usage metrics is available 48-96 hours after online publication and is updated daily on week days.
Initial download of the metrics may take a while.