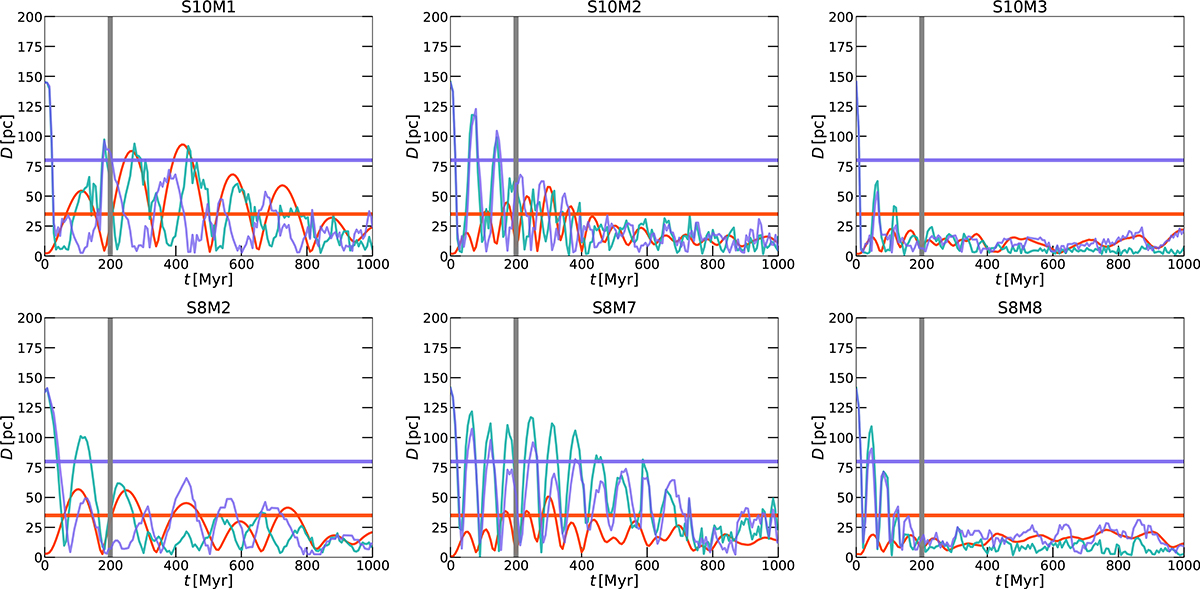
Fig. A.5.
Download original image
Scenario III: Gas offset models, showing the temporal evolution of the centre of mass of the stellar components (red), the peak of the surface gas density (blue) to the dark matter centre of mass. The top panels show models with one gas component, whereas the bottom panels show models with two gas components. We also show the distance between the stellar centre of mass and the gas surface density peak (turquoise). The respective simulations and used dwarf models are listed in the Table 1 correspond to model M15 with the dwarf model D1 (top left, S10M1), M16 with D2 (top middle, S10M2), M17 with D4 (top right, S10M3), M18 with D1t (bottom left, S8M2), M19 with D2t (bottom middle, S8M7) and M20 with D4t (bottom right, S8M8).
Current usage metrics show cumulative count of Article Views (full-text article views including HTML views, PDF and ePub downloads, according to the available data) and Abstracts Views on Vision4Press platform.
Data correspond to usage on the plateform after 2015. The current usage metrics is available 48-96 hours after online publication and is updated daily on week days.
Initial download of the metrics may take a while.