Fig. A.3.
Download original image
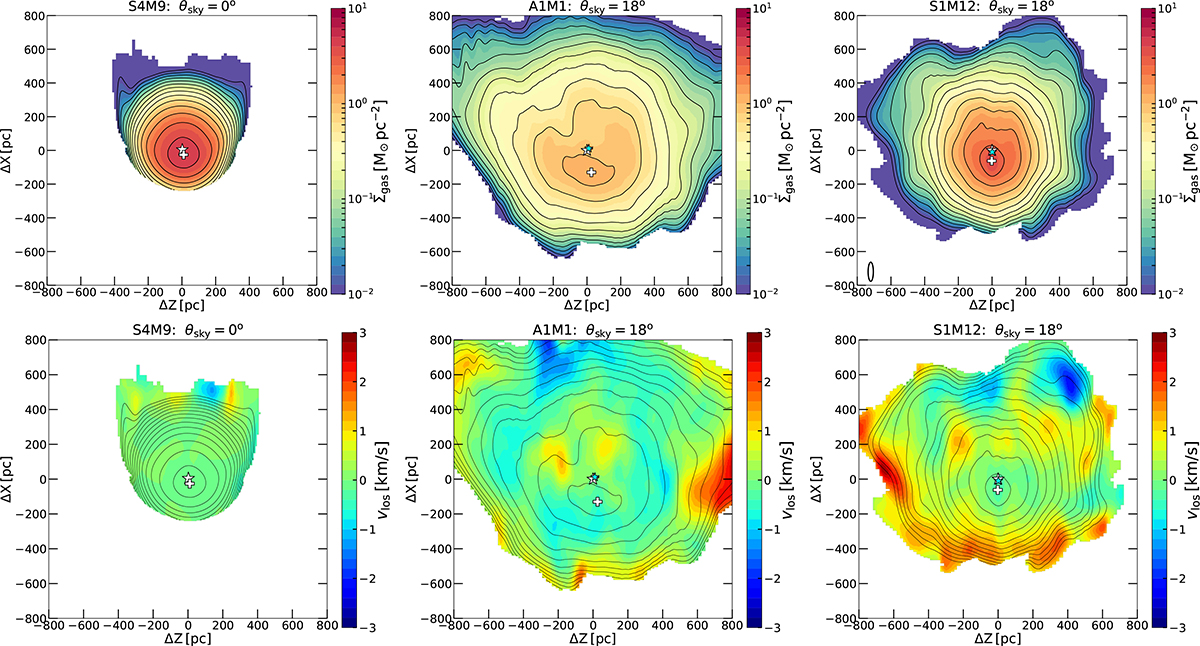
Testing the effects of the WSRT data beam size in models from Scenario I (left column) with the IGM perturbed model M5 (S4M9) and from Scenario II with models M8 (A1M1) and M10 (S1M12) in the middle and right columns, respectively. The maps of the gas surface mass density (top row) and the velocity field (bottom row) are convolved with a Gaussian (2D) kernel with the observed beam size (AO18) of 2(σz,σx) = (15.7, 57.3) arcsec = (31, 113) pc, showed in the top right panel (black ellipse). The centre of mass of the dark-matter/old stellar population (white star), the younger stellar population (cyan star), and the gas surface density peak (cross) are marked. We note that 1) the Gaussian smoothing with the masked hot gas results in some masked cold gas cells as well, and 2) ![]() corresponds here to NHI = 1.2 × 1020 cm−2.
corresponds here to NHI = 1.2 × 1020 cm−2.
Current usage metrics show cumulative count of Article Views (full-text article views including HTML views, PDF and ePub downloads, according to the available data) and Abstracts Views on Vision4Press platform.
Data correspond to usage on the plateform after 2015. The current usage metrics is available 48-96 hours after online publication and is updated daily on week days.
Initial download of the metrics may take a while.