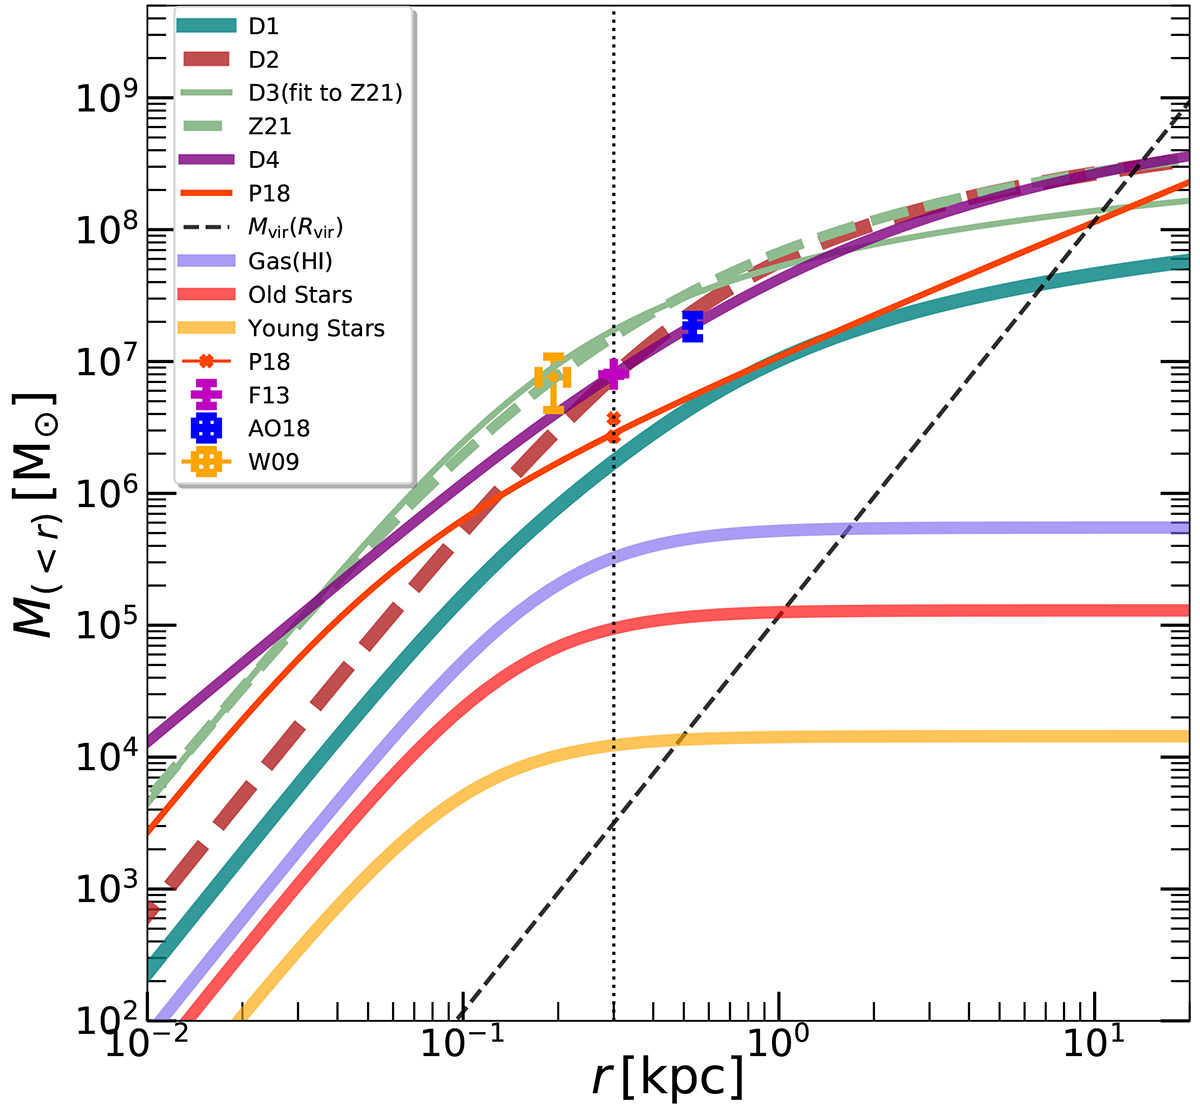
Fig. 1.
Download original image
Cumulative mass radial profiles of the dwarf galaxy models used for Leo T shown in Table 1: Our fiducial Burkert model D1, the massive Burkert model D2, and the NFW model D3. We also show the pseudo-isothermal dark halo model of Patra (2018) (P18) fitted to HI kinematic data of AO18, and the model of Zoutendijk et al. (2021) (Z21) with our adapted model D4 fitted to match a Burkert model within 400 pc. The models include gaseous and stellar components; we also plotted them separately modelled by Plummer mass profiles with parameters determined from observations (de Jong et al. 2008; Weisz et al. 2012; Adams & Oosterloo 2018; Blaña et al. 2020). We include dynamical mass estimates derived from gaseous kinematics (F13, A18, P18; Faerman et al. 2013; Adams & Oosterloo 2018; Patra 2018) and stellar kinematic observations (W09; Walker et al. 2009). The dashed black line indicates the relation between the virial mass (Mvir) and radius (Rvir) where we truncate the halos. The vertical dotted line marks the standard mass radius M300 at 300 pc (Strigari et al. 2008), used here to compare the masses between dwarf models in Table 1.
Current usage metrics show cumulative count of Article Views (full-text article views including HTML views, PDF and ePub downloads, according to the available data) and Abstracts Views on Vision4Press platform.
Data correspond to usage on the plateform after 2015. The current usage metrics is available 48-96 hours after online publication and is updated daily on week days.
Initial download of the metrics may take a while.