Fig. 9
Download original image
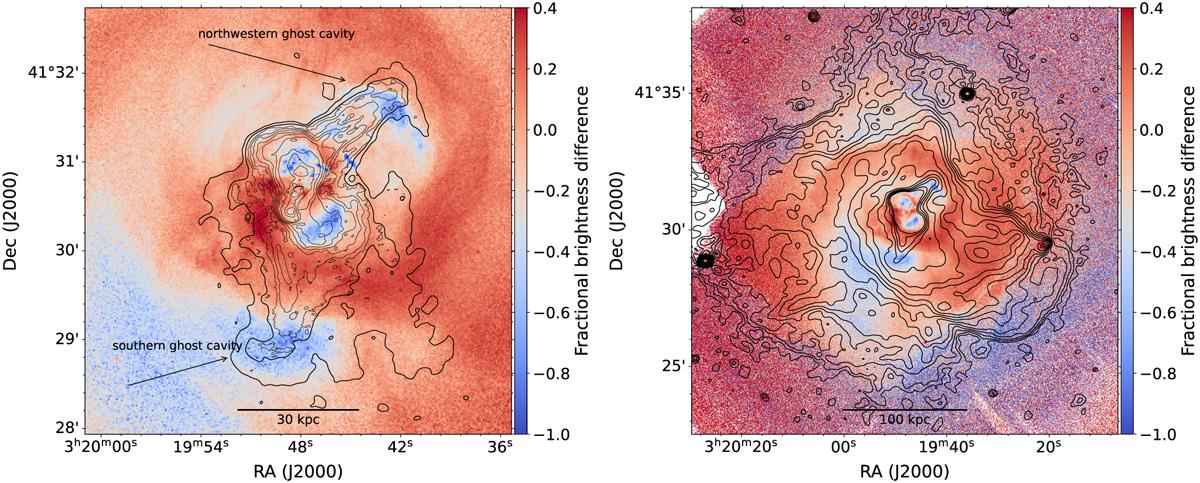
Chandra 0.5–2.0 keV fractional residual X-ray images with radio contours overlaid. These images were made by subtracting a radially averaged profile from the original X-ray image and then dividing it by the original. The contours in the left panel are from the 1.6″ and 3.4″ resolution LOFAR images and drawn at ten logarithmically spaced levels between 10σrms and 1000σrms and levels of 12σrms × [1,2], respectively. The two X-ray ghost cavities are labeled. The contours in the right panel are from the 7″ resolution image and drawn at levels of ![]() .
.
Current usage metrics show cumulative count of Article Views (full-text article views including HTML views, PDF and ePub downloads, according to the available data) and Abstracts Views on Vision4Press platform.
Data correspond to usage on the plateform after 2015. The current usage metrics is available 48-96 hours after online publication and is updated daily on week days.
Initial download of the metrics may take a while.