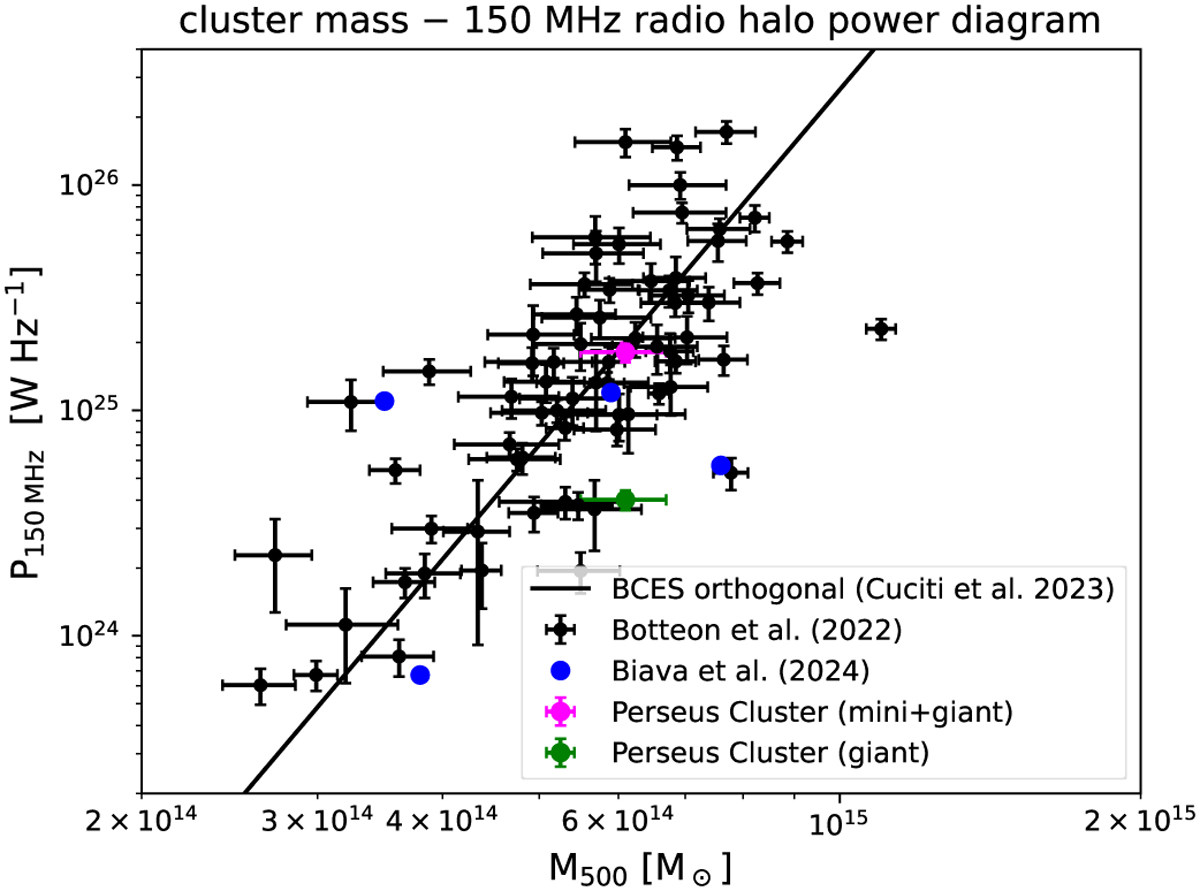
Fig. 15
Download original image
150 MHz radio halo power against cluster mass (M500). The black data points were taken from Botteon et al. (2022a). The blue points are from Biava et al. (2024), where the emission from the mini-halo component was removed. The solid line shows the best-fit correlation using the BCES orthogonal method from Cassano et al. (2023). The magenta data point is for the combined emission from the radio halo and the mini-halo. The green point is for the giant radio halo only. The flux densities to compute the radio power came from our radial surface-brightness profile fitting (Eq. (1)), integrated out to 3re. For the blue data point, we simply added the individual “halo components” integrated out to their own specific 3re values.
Current usage metrics show cumulative count of Article Views (full-text article views including HTML views, PDF and ePub downloads, according to the available data) and Abstracts Views on Vision4Press platform.
Data correspond to usage on the plateform after 2015. The current usage metrics is available 48-96 hours after online publication and is updated daily on week days.
Initial download of the metrics may take a while.