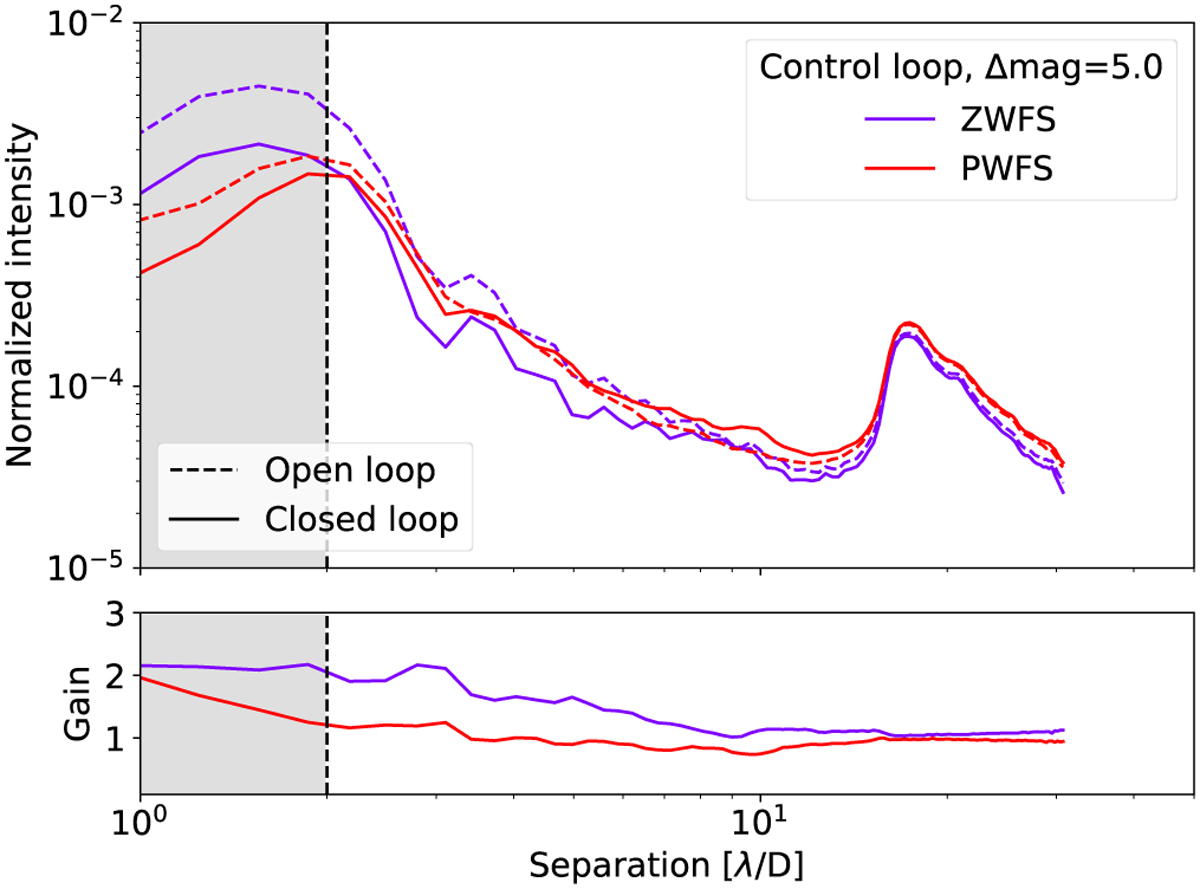
Fig. 11
Download original image
Contrast in the coronagraphic images with the ZWFS and PWFS control loops for low source flux conditions. Top: normalized azimuthal averaged intensity profile of the coronagraphic images produced for the control loop with the ZWFS (purple) and the PWFS (red) in open loop (dashed line) and closed loop (solid line) as a function of the angular separation for a source flux with ∆mag=5.0. The grey area with dashed line delimits the projected FPM size. The AO residuals are based on the VLT/SPHERE characteristics with a 6-mag natural guide star and median observing conditions with 10m s−1 and 0.7″ seeing. In closed loop, the second stage AO controls 350 KL modes and runs with an integrator using an optimal gain. Bottom: contrast gain provided by the different control loops between the open and closed loop operations.
Current usage metrics show cumulative count of Article Views (full-text article views including HTML views, PDF and ePub downloads, according to the available data) and Abstracts Views on Vision4Press platform.
Data correspond to usage on the plateform after 2015. The current usage metrics is available 48-96 hours after online publication and is updated daily on week days.
Initial download of the metrics may take a while.