Fig. B.1
Download original image
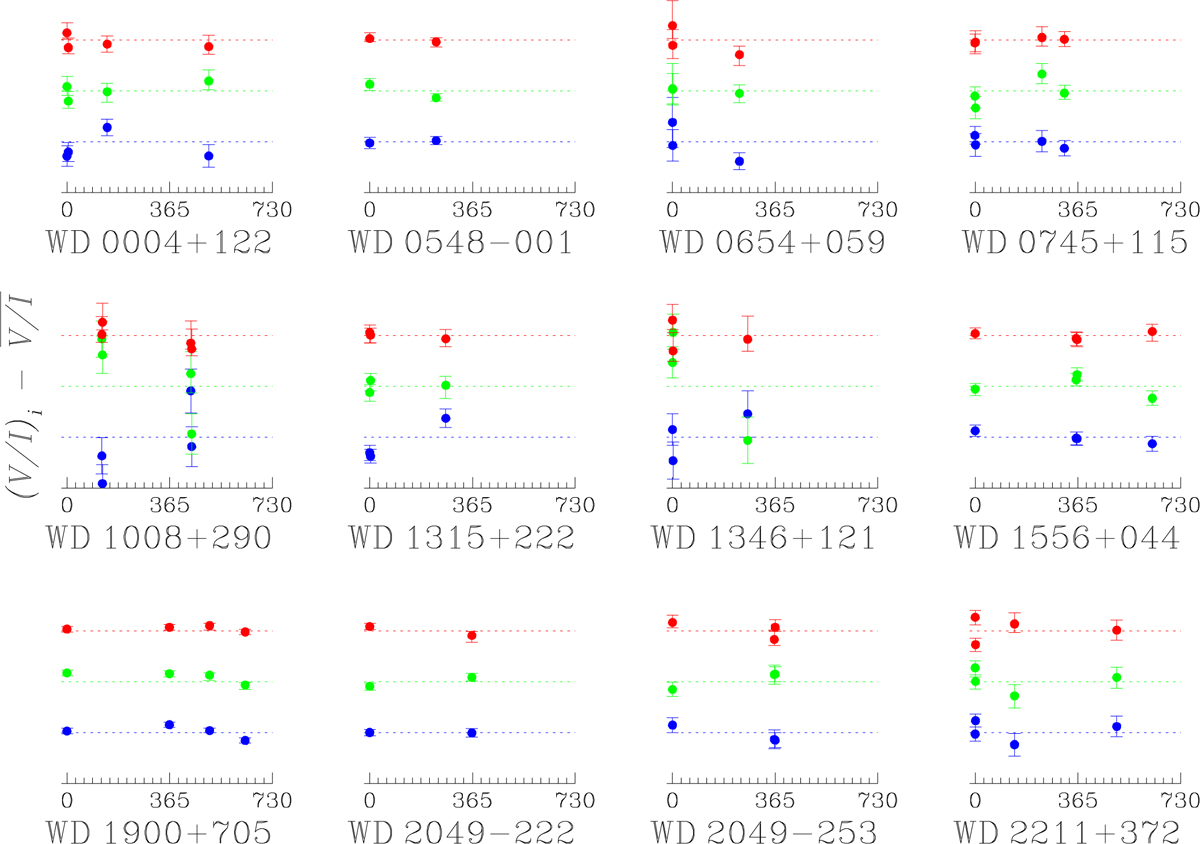
Variation in the broadband circular polarisation measurements observed in three filters B′V′R′ of the DiPol-UF instrument at the NOT (Berdyugin et al. 2022, 2023, 2024). In each panel, the three dotted lines represent the average of all data obtained in a particular filter: from top to bottom, the R‘ filter (red dotted line), the V‘ filter (green dotted line) and the B‘ filter (blue dotted line). These lines are separated by ∆V/I = 0.3 %. The x-axis represents the time of the observations in days from the first measurement. The solid circles represent the difference between each measurement and the average of all measurements in a given filter (red circles for filter R′ , green circles for filter V′, and blue circles for filter B′ .
Current usage metrics show cumulative count of Article Views (full-text article views including HTML views, PDF and ePub downloads, according to the available data) and Abstracts Views on Vision4Press platform.
Data correspond to usage on the plateform after 2015. The current usage metrics is available 48-96 hours after online publication and is updated daily on week days.
Initial download of the metrics may take a while.