Open Access
Fig. B.10
Download original image
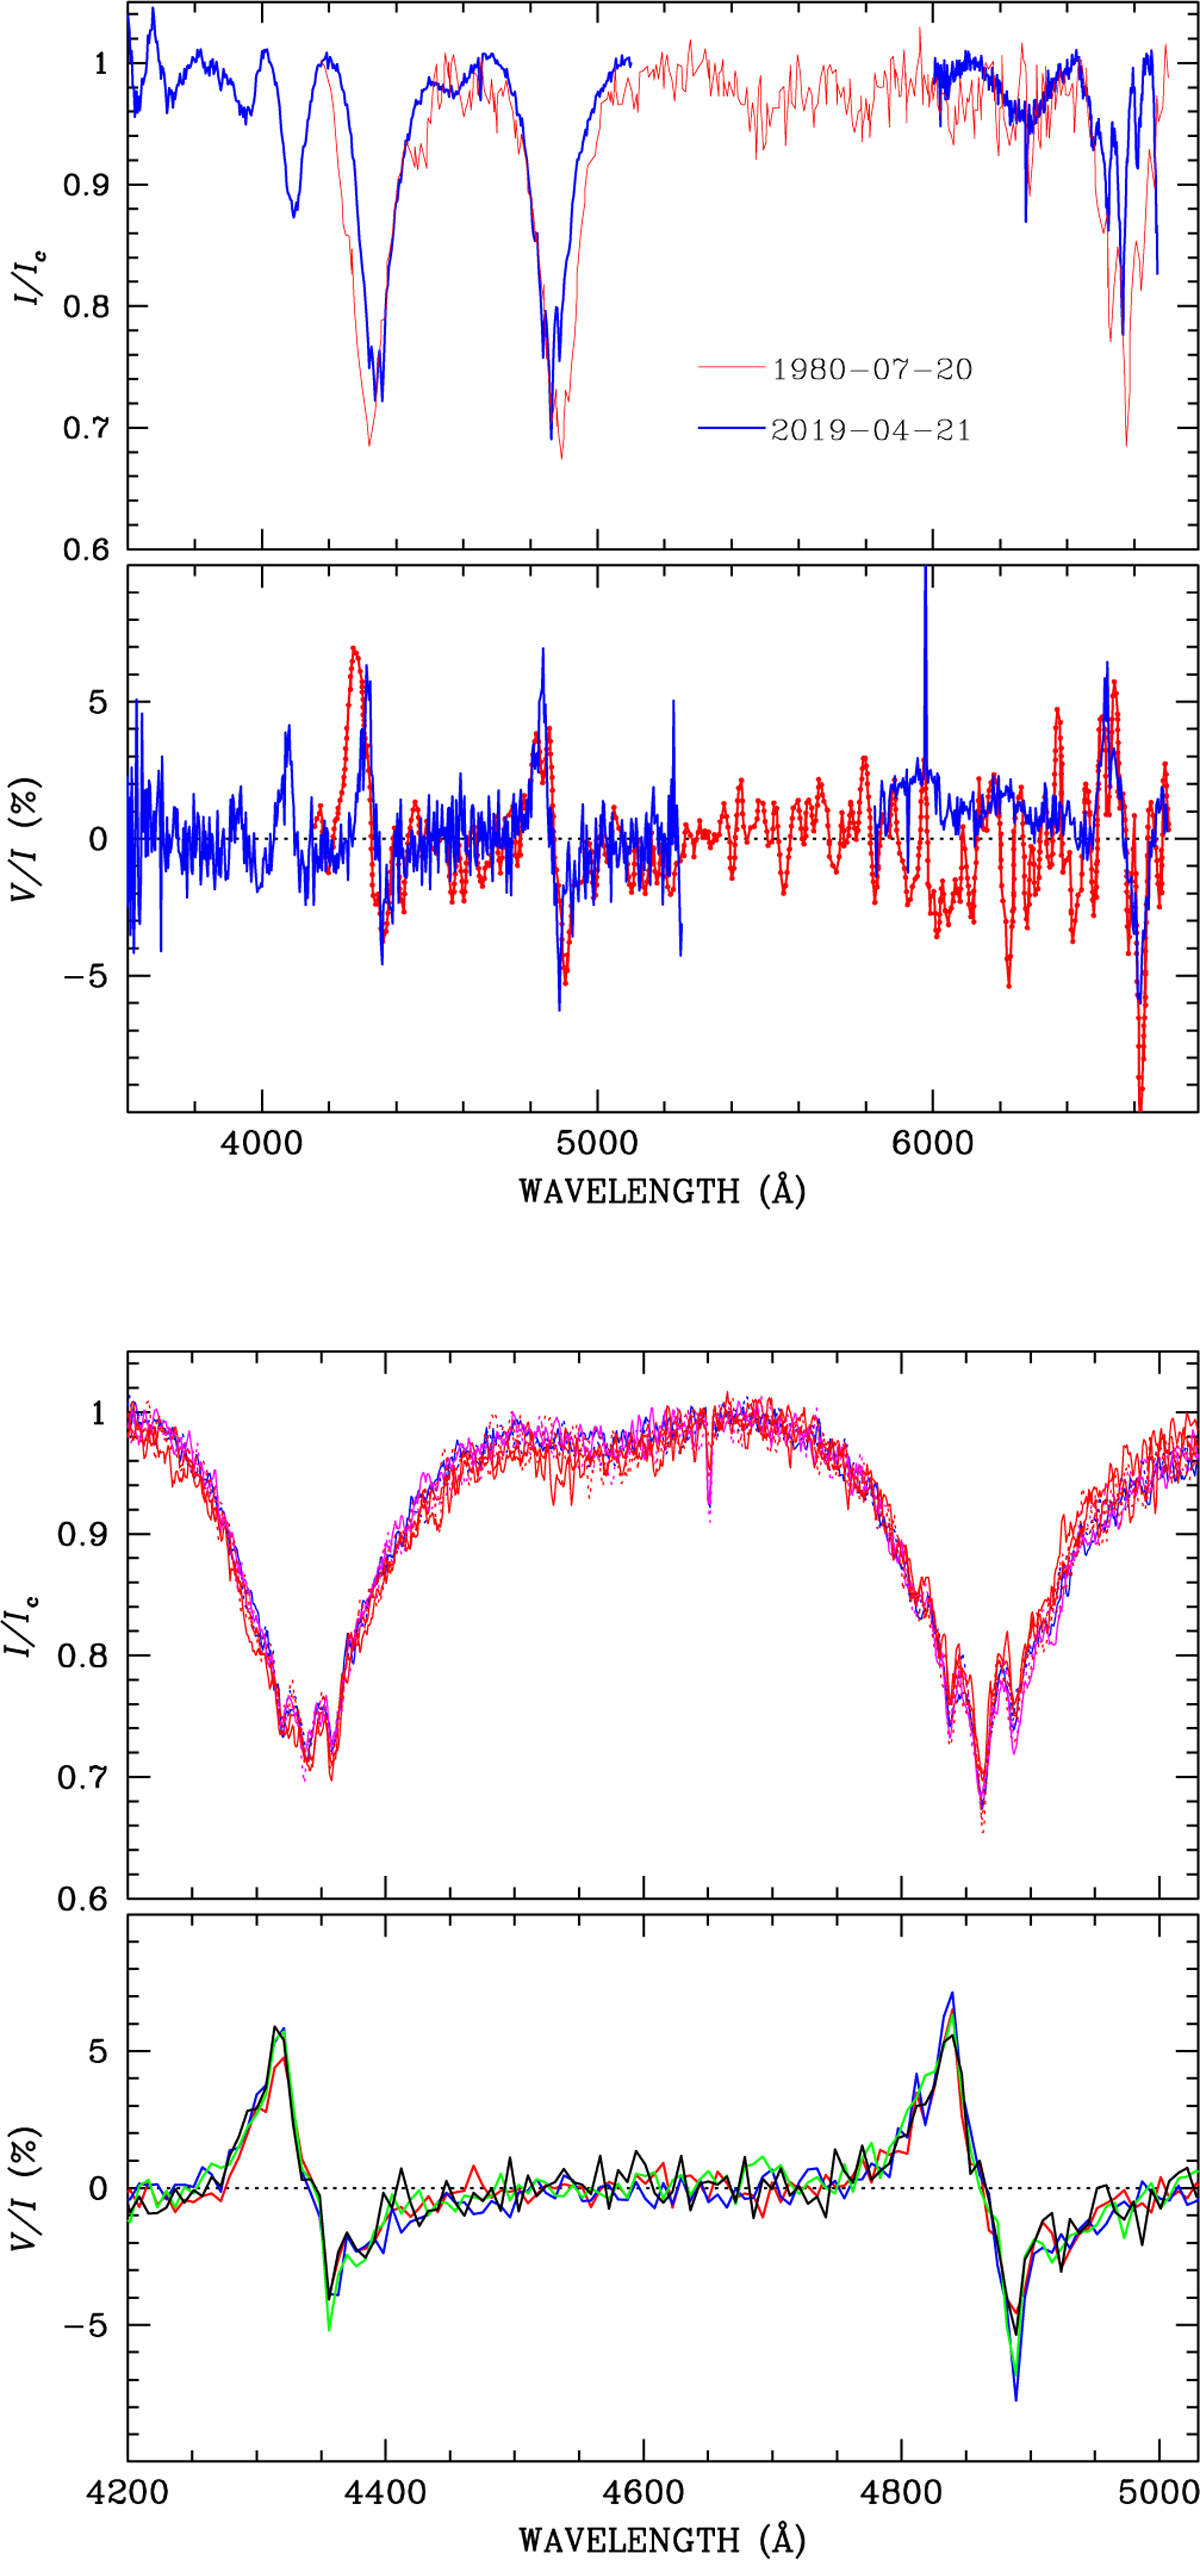
Top panels: Comparison of spectra of WD 1658+440 obtained in 1980 (Liebert et al. 1983) and in 2019 (this work). Bottom panels: Overplot of eight intensity spectra obtained in sequence with 450s exposure time, and of four circular polarisation spectra obtained from pairs of frames obtained in sequence.
Current usage metrics show cumulative count of Article Views (full-text article views including HTML views, PDF and ePub downloads, according to the available data) and Abstracts Views on Vision4Press platform.
Data correspond to usage on the plateform after 2015. The current usage metrics is available 48-96 hours after online publication and is updated daily on week days.
Initial download of the metrics may take a while.