Fig. 1
Download original image
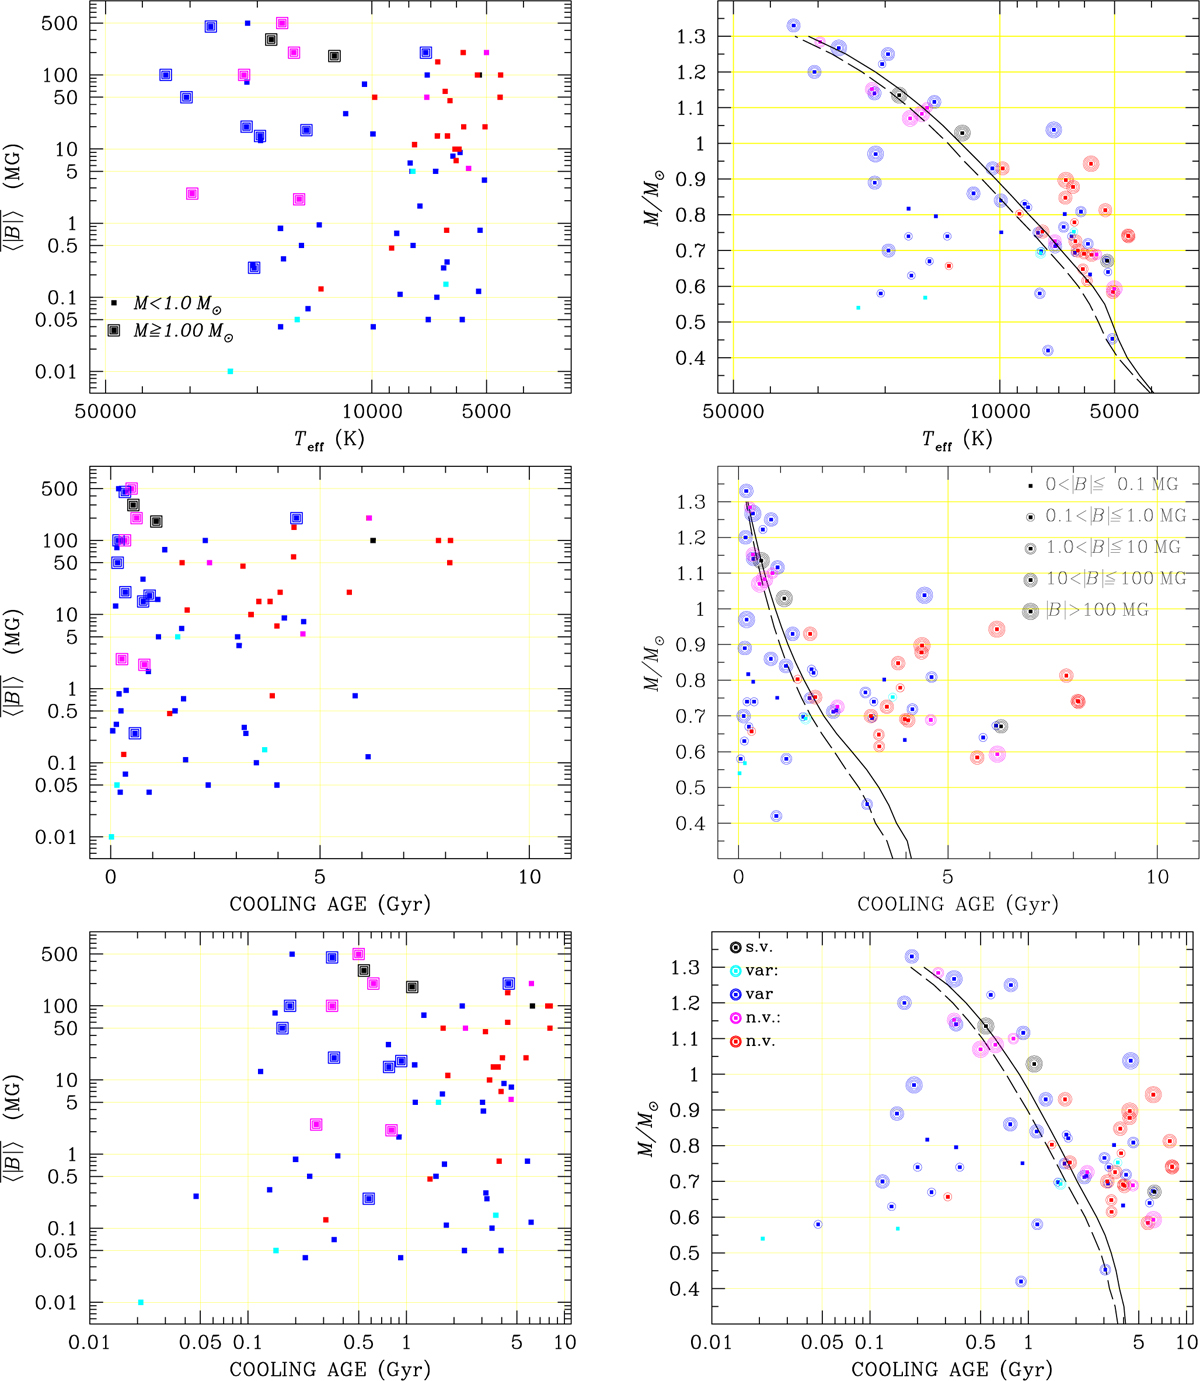
Correlations between field strength, magnetic variability, and other stellar parameters. Left panels: field strength versus effective temperature and versus cooling age for variable and non-variable stars of Table 1. The size of the symbols is related to the mass of the star as shown in the legend. Red symbols refer to stars that were observed at least three times with no evidence for variability; magenta symbols are for stars that were observed only twice and are tentatively assumed non-variable. Blue symbols refer to stars that show variability. Light blue symbols indicate stars that show marginal but probably real signs of variability, maybe due to a field nearly aligned with the rotation axis. Black symbols are used for stars that show signs of long-term variability that we were not able to interpret. Right panels: temperature-mass and cooling age-mass diagrams for the same sample of stars. The size of the symbols is related to the field strength as shown in the legend. The meaning of the colour is the same as for the left panels. Black lines represent the onset of crystallisation (solid line for H-thick envelop and dashed line of H-thin envelop) obtained via interpolation of the cooling tables by Bédard et al. (2020). In all panels, the yellow vertical and horizontal lines highlight the position of the box tick marks. We recall that these diagrams do not refer to a volume-limited sample and that both young normal-mass magnetic white dwarfs and highly massive magnetic white dwarfs, which are rare objects in space, are over-represented.
Current usage metrics show cumulative count of Article Views (full-text article views including HTML views, PDF and ePub downloads, according to the available data) and Abstracts Views on Vision4Press platform.
Data correspond to usage on the plateform after 2015. The current usage metrics is available 48-96 hours after online publication and is updated daily on week days.
Initial download of the metrics may take a while.